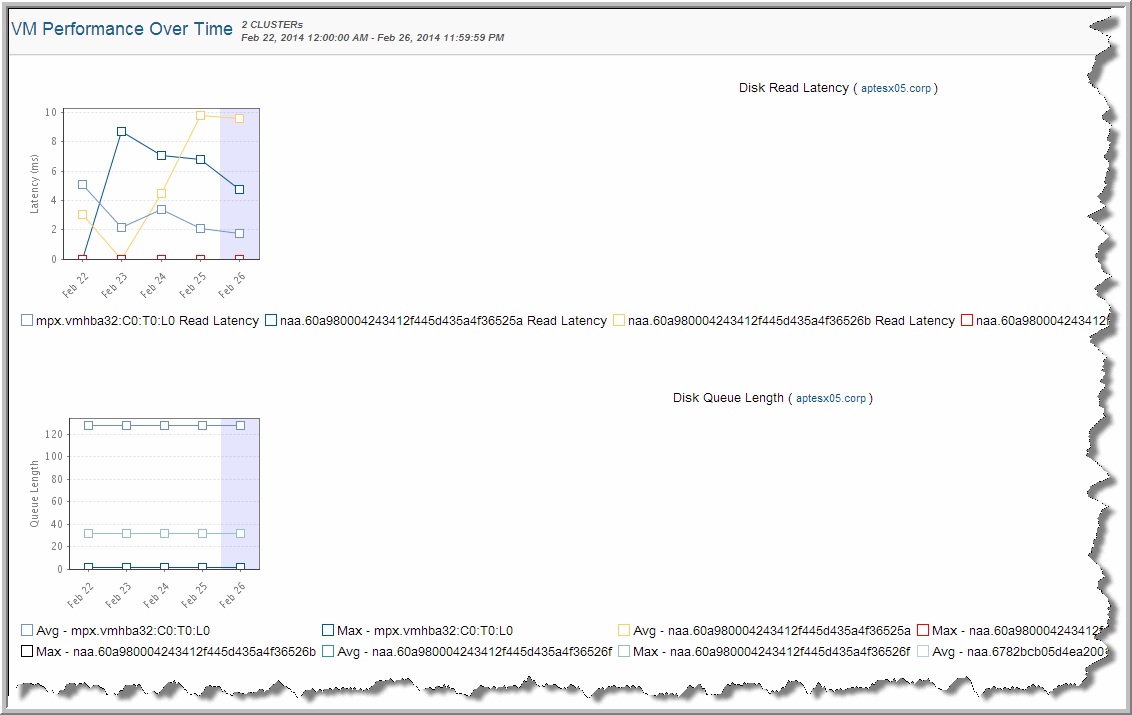
VM Performance Over Time
Use Quick Search to find a template, report or dashboard by name. Search is case insensitive, supports partial entries, and will display a list of potential matches.
As you enter the name in the Quick Search field, up to 10 potential matches are displayed. If the template, report or dashboard is shown, you can select and run it directly from the match list. You can also click All Items in the match list to go directly to the Search Results.
Use the Explorer to browse through the StorageConsole templates, dashboards and reports. The navigation pane displays templates organized by products along with user created, and system folders. This report is located here:
Virtualization Manager > Performance Reports > VM Performance Over Time
Disk Read and Write Latency is available only for ESX Hosts (not VMs). Therefore, latency performance charts are available only for partitions of Type=Host.
Use the scope selector to aggregate at the ESX Cluster level or an arbitrary Host Group level. If selected only individual ESX Clusters and Host Groups of ESX servers are reported on. Rendered graphs represent aggregate performance of all individual ESX servers in the Cluster or Host Group. You can drill down to the VM Detail report and VM Server Detail.

