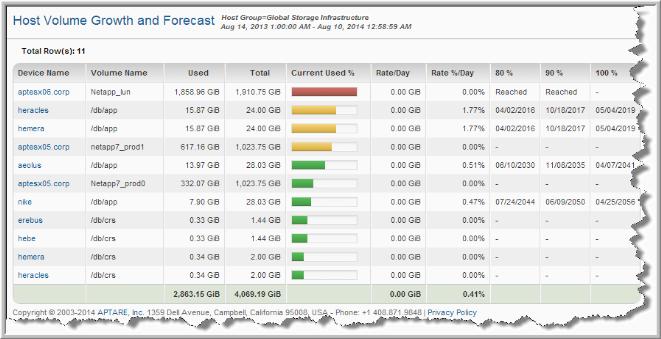
Host Volume Growth and Forecast
Use Quick Search to find a template, report or dashboard by name. Search is case insensitive, supports partial entries, and will display a list of potential matches.
As you enter the name in the Quick Search field, up to 10 potential matches are displayed. If the template, report or dashboard is shown, you can select and run it directly from the match list. You can also click All Items in the match list to go directly to the Search Results.
Use the Explorer to browse through the StorageConsole templates, dashboards and reports. The navigation pane displays templates organized by products along with user created, and system folders. This report is located here:
Capacity Manager > Storage Capacity & Forecast > Host Volume Growth and Forecast
This report lists from the host perspective, all discovered file systems, capacities, growth rates and projected out-of-space conditions allowing you to monitor system (physical and virtual) volume usage and avoid service outages. The time frame for the forecast is set in scope selector when you generate a report.
Device Name | Host name. |
Volume Name | Volume name. |
Used | Amount of used capacity for the file system from host perspective. The value for the Used column is always the current used, but the projection is based on the time period set in the scope selector. |
Total | Total allocated capacity of the file system from host perspective. |
Current Used % | Thermometer 0% to 100%, colored green, yellow, red according to the current utilization of the file system. |
Rate/Day | Average daily growth of the file system. |
Rate %/Day | Average daily percentage increase or decrease for the file system. |
80% | Expected date when the file system will reach 80% capacity, or an indication it has been reached. |
90% | Expected date when the file system will reach 90% capacity, or an indication it has been reached. |
100% | Expected date when the file system will reach 100% capacity, or an indication it has been reached. |

