Media Availability Forecast
Use Quick Search to find a template, report or dashboard by name. Search is case insensitive, supports partial entries, and will display a list of potential matches.
As you enter the name in the Search field, up to 10 potential matches are displayed. If the template, report or dashboard is shown, you can select and run it directly from the match list. You can also click All Items in the match list to go directly to the Search Results.
Use the Explorer to browse through the StorageConsole templates, dashboards and reports. The navigation pane displays templates organized by products along with user-created, and system folders. This report is located here:
Backup Manager > Forecasting & Capacity Planning > Media Availability Forecast
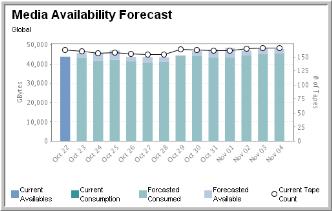
The Media Availability Forecast plots forecasted consumption against forecasted availability. This report is NetBackup-specific.
The system calculates the forecasted consumption by the close of each day, using the following algorithm:
(previous day’s availability + forecasted media expiration - forecasted consumption)
In order to forecast the 7 days of usage, the system averages day-of-the-week consumption data for a historical period specified in the “Historical Data Period” parameter on the Media Forecasting Dashboard scope selector.
When forecasting the number of tapes consumed on each day, the system tallies the GByte consumption for all backups written to tape per media type in each volume group. The system then divides the total GByte consumption for that volume group / media type by the estimated capacity of that media type in that volume group. This process is repeated for each volume group / media type instance within the scope of the report and the aggregated tape consumption results are displayed via the circular line symbols in the bar chart.
The circular line symbol tracks the # of tapes available for each day displayed on the chart.
Place your mouse over each colored portion of a bar to see the following details for the associated time period:
• Currently Available Storage Media
• Current Consumption
• Forecasted Consumption
• Forecasted Available
• Forecasted Tape Availability (mouse over connected circles at the top of the bars)