Storage Unit Details | The name of the storage unit. |
Mgmt Server Details | Click on the Management Server name link to go to the corresponding Host Details Report. |
Media Server Details | Click on the Media Server name link to go to the corresponding Host Details page. |
Storage Unit Filesystem Info | Each storage unit has an associated path name that determines where the backups are stored. The report shows both the path name and the actual filesystem on which the storage unit resides. If more than one storage unit shares the same filesystem, the report lists the names of the other storage units. It’s important to know if other storage units share the same filesystem, since any physical free space on the filesystem will be shared as one common pool by all the storage units for that filesystem. The Filesystem Capacity (MB) field is populated only if Discovery has been enabled. |
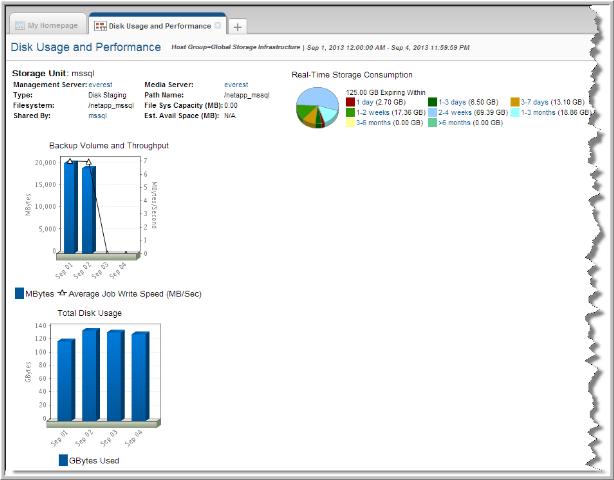
Real-Time Storage Consumption | Shows the amount of data on the Storage Unit for the selected report scope, grouped by expiration period. Mouse-over the pie slices to view the total number of backups associated with the amount of allocated storage. Click a pie slice to go to the Storage Unit Details Report, which displays a list of all the active backups that fall within the expiration period and are within the report scope. |
Backup Volume & Throughput | Each bar in this graph represents the total number of GBytes written to the Storage Unit for backups jobs that completed during the period represented by the bar. Click on a bar to go to the Storage Unit Details Report, which displays a list of all the backups represented by the bar. The dotted line plotted against the secondary y-axis represents the Average Throughput of the backups for the period represented by each bar. The calculation only includes those jobs within the current report scope. The throughput is calculated as follows: backup volume/(sum of all backup durations in seconds) |
Total Disk Usage | Each bar in this graph represents the total amount of space in GBytes occupied by unexpired backups. |