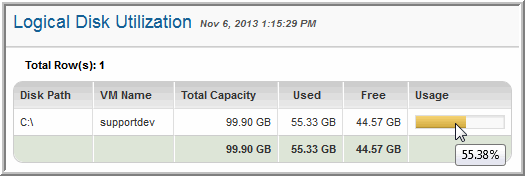
Logical Disk Utilization
Detail reports are related to a specific enterprise object, such as a backup job or SAN fabric. You can only access detail reports through a link presented in the context of a main report, providing additional information that augments the main report. Detail reports cannot be generated, customized, or saved, as they are specific to the report from which they were derived. Therefore, they will not be available in search results.
Use Quick Search to find the main template, report or a dashboard by name. Search is case insensitive, supports partial entries, and will display a list of potential matches.
As you enter the template, dashboard or report name in the Quick Search field, up to 10 potential matches are displayed. If the result is shown, you can select and run it directly from the match list. You can also select All Items to display the full search results page and further filter your results.
You can use the Explorer to browse through the StorageConsole templates, dashboards and reports. The navigation pane displays templates organized by products along with user created, and system folders. The main report is located here:
Virtualization Manager > Administration Reports > VM Summary
Click the Volume Usage thermometer.
Disk Path | The path to the logical disk |
VM Name | Virtual machine name |
Total Capacity | Total amount of storage allocated to the VM |
Used | Amount of the VM’s allocated storage that is in use |
Free | Amount of the VM’s allocated storage that is available for use |
Usage | A thermometer represents the percentage of disk usage |

