Monitoring Data Collectors
You can monitor data collection from a single window. This functionality is very useful if your environment contains more than one backup solution or collectors for multiple enterprise objects. A Data Collector regularly queries your enterprise objects for specific information, and each information type is called a collection task. Each collection task runs at specific intervals, and not all collection tasks run at the same intervals.
A collection task doesn’t always return data because sometimes there isn’t any data to return. However, when the collection task returns data, this historical information is used to determine the collection task’s activity pattern or threshold.
Most collection tasks run between every 20 minutes to 24 hours. However, one collection task, the Backup Job Completed Event, can post data several times a second at the height of the backup window, thereby setting the historical period for posting data to a very short interval. Subsequently, when the backup window is closed and no backups are being performed, the status monitoring might indicate an alert for this data collection component. If you have a backup window with heavy activity and then no or little activity, you may encounter some false positives for this component. If this component indicates it has not captured any data for more than 24 hours, then the component likely indicates an issue that requires investigation.
To monitor the Data Collector
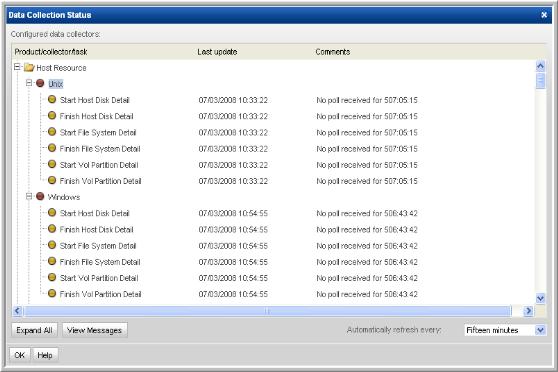
1. Select Admin > Data Collection > Status.
2. Click Expand All.
The last update and status from the individual collectors are aggregated up to the Data Collector/Master Server level. Collectors can be shown or hidden using the +/- icon.
Status shows the state of the task. There are four possible states:
* Blue - The task is operating within correct thresholds.
* Amber - The task is operating outside of the usual thresholds, but is still operational.
* Red - The task has failed.
* White - There is no data for the task.
NOTE: The parent collector will display a red status if there are two or more child tasks that are in an amber warning state.
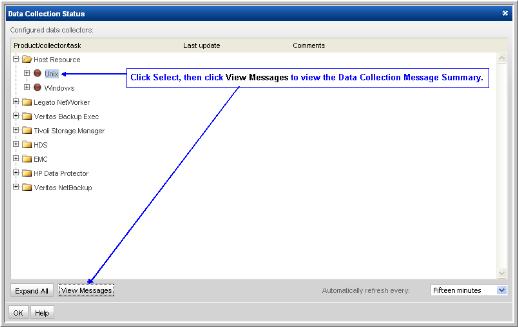
3. Verify that Data Collector or agent processes are running on the Data Collector host. Check for exceptions in the Data Collector log files by selecting a collector and clicking View Messages.
NOTE: Currently, messages are available only for EMC NetWorker, HP Data Protector, and Capacity Manager Host Resources. Therefore, the View Messages button will not be accessible for other types of messages.
For additional details about the Collection Message Summary report, see the APTARE StorageConsole Report Reference Guide.
4. If the Data Collector remains in an error state for more than 24 hours, call the APTARE Global Support Services for troubleshooting assistance.