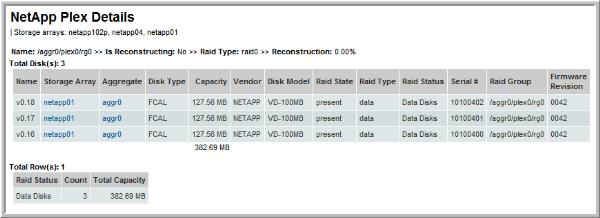
NetApp Plex Details
Detail reports are related to a specific enterprise object, such as a backup job or SAN fabric. You can only access detail reports through a link presented in the context of a main report, providing additional information that augments the main report. Detail reports cannot be generated, customized, or saved, as they are specific to the report from which they were derived. Therefore, they will not be available in search results.
Use Quick Search to find the main template, report or a dashboard by name. Search is case insensitive, supports partial entries, and will display a list of potential matches.
As you enter the template, dashboard or report name in the Quick Search field, up to 10 potential matches are displayed. If the result is shown, you can select and run it directly from the match list. You can also select All Items to display the full search results page and further filter your results.
You can use the Explorer to browse through the StorageConsole templates, dashboards and reports. The navigation pane displays templates organized by products along with user created, and system folders. The main report is located here:
Capacity Manager > Array Capacity & Utilization > Array Capacity & Utilization
Next, click # Aggregates.
NOTE: The # of Aggregates is not listed for a VFiler, as it is not relevant.
Then, in the Aggregate Utilization Summary, click a Plex link.
This drilldown sequence launches the Plex Details report, which displays a list of details for each of the disks in the Plex’s disk pool. Use this report to understand how the RAID groups and disks are organized and configured.
RAID Reconstruction Status:
Name | Name of the Plex |
Is Reconstructing? | Y or N During RAID reconstruction, as a result of a disk failure, redundant data is read from other disks to recreate the blocks from the failed disk. |
Reconstruction % | If reconstruction is in progress, this value shows the completion percentage. |
Plex Disk Pool Details:
See
NetApp Disk Summary for a description of these fields.

