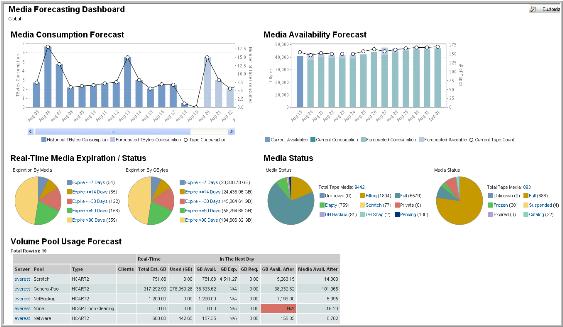
Media Consumption Forecast | NOTE: Click on the Total Volume Pools link to display the same chart in a new window. A chart appears for each volume pool within the report scope. The dark blue bars indicate historical consumption while the light blue bars indicate consumption predicted for the next 7 days. In order to forecast the 7 days of usage, the report averages day-of-the-week consumption data for the historical period that you specified in the report scope. In order to forecast the number of tapes consumed each day, the system calculates forecasted consumption by the close of each day using the following algorithm: 1. Tally the GByte consumption for all backups written to tape per media type in each volume group. 2. Divide the total GByte consumption for that volume group/media type by the estimated capacity of that media type in that volume group. Repeat for each volume group/media type instance within the report scope. The chart displays the aggregate tape consumption results using the circular line symbols. |
Pop-up Details | Mouse‑over any of the bars or symbols on the chart to display pop-ups that provide details. |
Drillable Bars | Click on any historical consumption bar to drill down to the Media Usage Detail Report for that day. |
Media Availability Forecast | The Media Availability Forecast plots forecasted consumption against forecasted availability. NOTE: Click on the Total Volume Pools link to display the same chart in a new window. A chart appears for each volume pool within the report scope. In order to forecast the number of tapes consumed each day, the system calculates forecasted consumption by the close of each day using the following algorithm: 1. Tally the GByte consumption for all backups written to tape per media type in each volume group. 2. Divide the total GByte consumption for that volume group/media type by the estimated capacity of that media type in that volume group. Repeat for each volume group/media type instance within the report scope. The system calculates the forecasted availability for the close of each day using the following algorithm: previous day’s availability + forecasted media expiration - forecasted consumption |
Media Availability Alerts | The circular line symbol tracks the # of tapes available for each day that the report displays. If the number of tapes available drops below the Availability Threshold, the symbol is red. The default for the Availability Threshold is 25, but you can configure this value for each portal instance. |
Media Expiration By Tapes & GBytes | Media Expiration is displayed on a by-Tape and by-GByte basis in the first two pie charts. NOTE: Click on the Total Volume Pools link to display the same chart in a new window. A chart appears for each volume pool within the report scope. Mouse-over any pie slice to display pop-ups that provide display the data associated with that slice. Click on any of the pie slices or associated legend items to go to the Media Summary report, which shows all the media that expires within the associated time frame. Each piece of media is associated with the slot # as well as the expiration date so that you can easily select and remove media from the library. Each of the Expiration Time Frame Policies defaults to the following: Expire <= 7 Days Expire <= 30 Days Expire <= 90 Days Expire <= 180 Days Expire > 180 Days The Expiration Time Frame Policies are globally configurable parameters for each portal instance. |
Real Time Media Status | The pie chart provides a real-time snapshot of all the media that the servers within the report scope are using. NOTE: Click on the Total Volume Pools link to display the same chart in a new window. A chart appears for each volume pool within the report scope. • Mouse‑over any of the pie chart sections to display pop-ups with pertinent details about the media of the corresponding status. • Click on any section of the pie chart to go to the Tape Media Summary report for all media with the corresponding status. • Click on the Total Tape Media link to go to the Tape Media Summary report for all the servers within the report scope. |
Scratch & Volume Pools By Media Type | A row for each type of media in each pool (media type/pool instance) within the report scope displays in the Volume Pool Usage Forecast. This report limits the total # of instances to eight. Click on the Total Volume Pools link located at the top right of the component to view a complete report which will include all the media type/pool instances within the report scope. If a scratch pool exists within the report scope, the report displays the scratch pool at the top of the report. If the forecasted consumption for any media type/pool instance exceeds the forecasted availability after the future time period that you selected in the report scope, the row instance is red. |