TSM Storage Pools Dashboard
Use Quick Search to find a template, report or dashboard by name. Search is case insensitive, supports partial entries, and will display a list of potential matches.
As you enter the name in the Quick Search field, up to 10 potential matches are displayed. If the template, report or dashboard is shown, you can select and run it directly from the match list. You can also click All Items in the match list to go directly to the Search Results.
Use the Explorer to browse through the StorageConsole templates, dashboards and reports. The navigation pane displays templates organized by products along with user created, and system folders. This report is located here:
Backup Manager > Administration Reports > TSM Storage Pools Dashboard
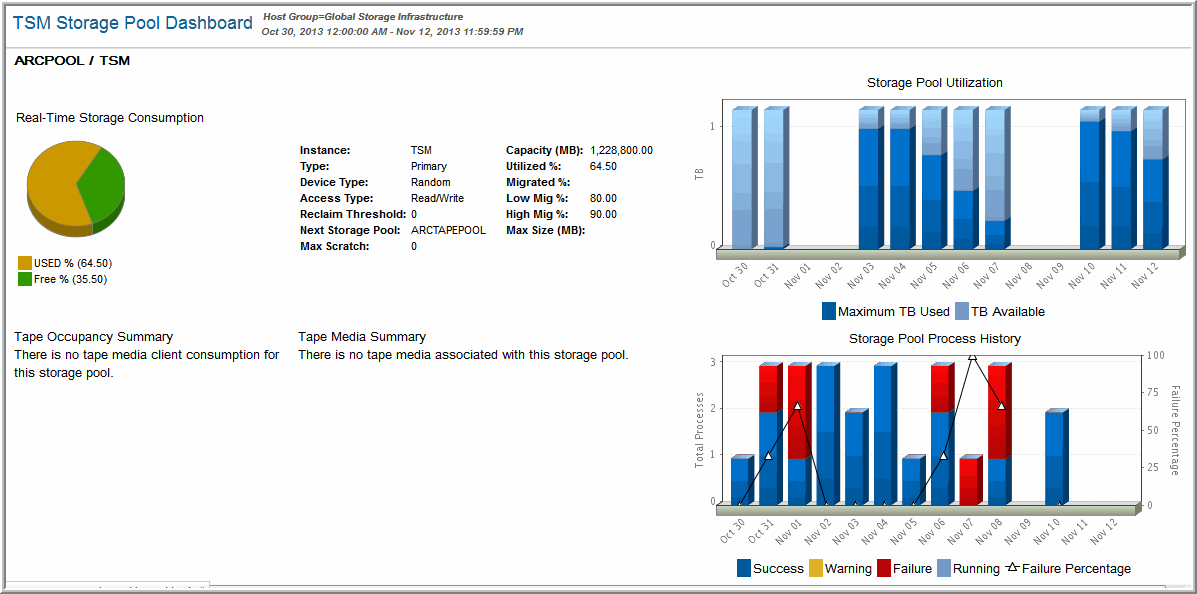
The TSM Storage Pools Dashboard provides a real-time view into capacity and process status information for the selected list of TSM Storage Pools. In a single pane, you quickly can analyze capacity and process status information for each of the Storage Pools.
Storage Pool Capacity
The pie chart displays the percentage and GBytes used and available for the Storage Pool. The GBytes Used is calculated by multiplying the percentage used by the estimated capacity of the Storage Pool.
Storage Pool Attributes
Instance | Backup Instance name |
Type | Primary, Copy |
Device Type | Sequential, Random |
Access Type | Read/Write, Read only |
Reclaim Threshold | TSM can reclaim volumes that exceed a reclamation threshold—that is, a percentage of unused space on the volume. This threshold value is set by the TSM administrator, within TSM. |
Next Storage Pool | The storage pool that is next in line for backups when the current pool reaches capacity—that is, the destination storage pool for migrated data. TSM automatically requests a storage pool when needed. |
Max Scratch | The maximum amount of scratch space allocated to the storage pool. When the number of scratch volumes that TSM is using for the storage pool exceeds the maximum number of scratch volumes specified, the storage pool can run out of space. |
Capacity (GB) | Storage pool capacity |
% Utilized | Percentage used |
% Migrated | Estimated percentage of storage that can be migrated |
Low Mig % | The value used by TSM to start/stop migration. This percentage indicates when the server should stop migrating files to the next available storage pool. |
High Mig % | The value used by TSM to start/stop migration. This percentage indicates when the server should start migrating files to the next available storage pool. |
Max Size (MB) | The maximum size of the storage pool. |
Storage Pool Utilization
This historical tracking bar chart displays the history of used and available capacity for the selected storage pool.
Tape Occupancy Summary
This pie chart displays a summary of the GBytes and number of tapes used by each client/server that occupy this Storage Pool. The chart displays the top eight tape media consumers of this Storage Pool. Click on any of the client/server names to view detailed tape media consumption information
Tape Media Summary
This pie chart shows a summary of all the tapes assigned to this Storage Pool. This pie chart displays both the percentage of tapes grouped by media status, and the number of tapes grouped by media status:
• Filling, Full, Pending. Empty, Unknown, StgPool, Private, Pending, Questionable
Storage Pool Process History
This historical tracking bar chart displays the summary status of any TSM process that used this Storage Pool. Examples of TSM processes that are plotted on this bar chart are: Storage Pool Backups, Migrations, Expirations. Click on a bar in this graph to view the
TSM Process Summary.

