Portal Overview
Understanding Portal terminology is a prerequisite for getting started. The following figure highlights naming conventions for each area in the interface.
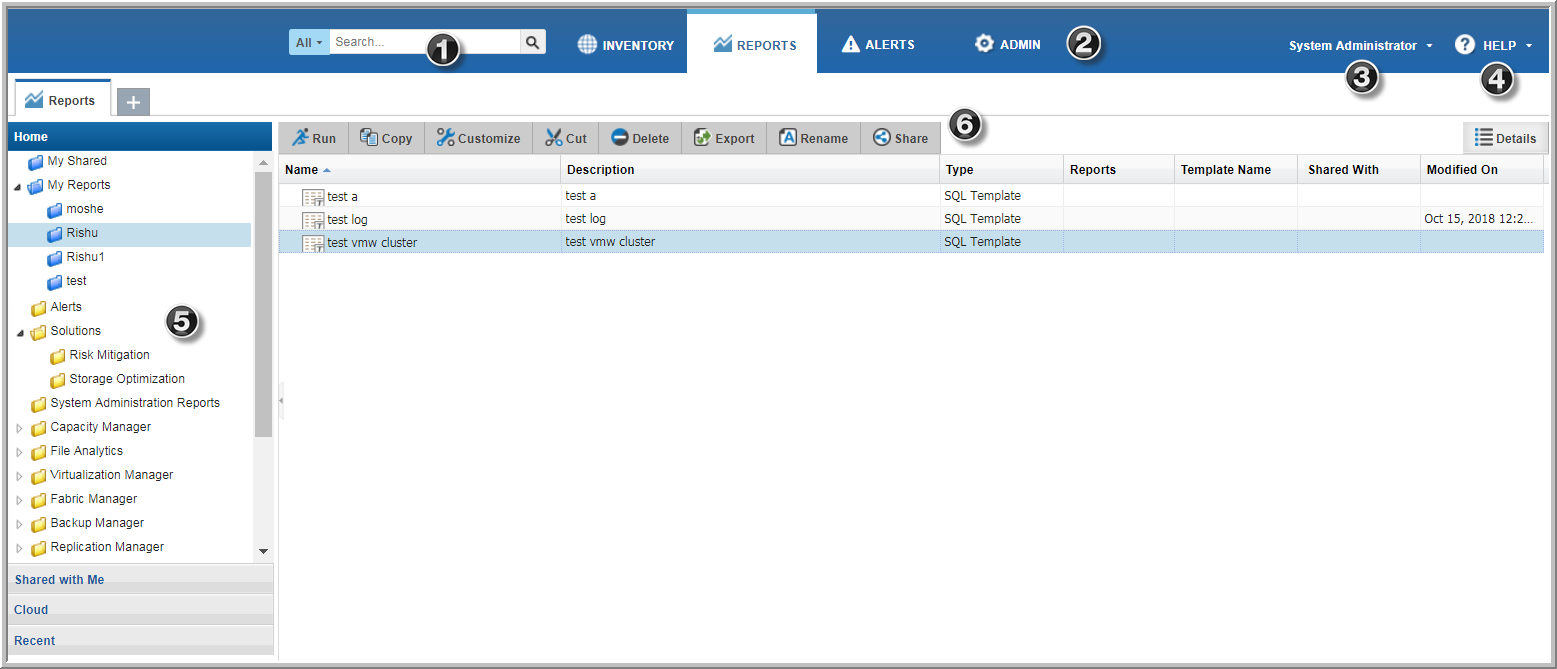
The Portal is organized into the following major sections, accessed from the top of your browser window.
1. Search - Use Search to discover, navigate to, and perform operations on a number of elements within the product. For example, navigate to the reports you require or find specific
Inventory objects and Data Collectors/Policies. Search is case insensitive, supports partial entries, and will display a list of potential matches using a string match. If the Cloud is enabled, search results will also include user report templates available from the cloud. Because you can directly run a report from your
Search results, this enables you to preview any cloud template before you save it locally. Results are displayed in a full search page that allows you to refine results further or start a new search. See
Valid Entries for Search.
2. Menu Bar
• Inventory -
Provides a browser view of your collected datacenter infrastructure inventory. This view allows you examine your data starting from a logical entry point to narrow down, find, and run the reports you require. You can quickly find the inventory object type within your infrastructure and view the relevant reports. Object-specific reports, summary pages are available, plus Host and Host Group management is enabled through the Inventory. See also
About the Inventory Tab. • Reports - A management window for your reporting inventory that allows you to browse, manage, create and customize templates, reports and dashboards. This tab provides access to designers that enable custom report template creation: the Dynamic Template Designer and the SQL Template Designer, an advanced feature, requiring experience in SQL (Structured Query Language) development. See also
About the Reports Tab. • Alerts - APTARE IT Analytics collects a variety of data on various aspects of your datacenter and provides reports to visualize the results. Alerting enables you create and configure real time alerts for specific conditions within your datacenter allowing for faster resolutions to issues that are important to your organization. See
About the Alert Tab.
• Admin - Provides consolidated access to functions that allow administrators to manage the Portal, create users, groups, set up data collection, plus set privileges for report and feature access. Also available, the Methods Designer, to create special processing methods to be included in report templates created with the Dynamic Template Designer and the File List Exporter (if you have licensed the File Analytics product). The exporter assembles file analytics metadata into a comma-separated values (.csv) file, and allows you to export for further analysis. See also
About the Admin Tab.
3. User Account Menu - This drop-down menu provides convenient access to account-specific features such as managing your profile information, your homepage, and access to your scheduled reports. For those assigned a Super User role, a
Clear Cache selection is also displayed for the purpose of debugging. See
Clearing the Inventory and Report Cache.
4. Help - Displays context sensitive help for the page. This menu also displays the software version (About).
5. Navigation Panel - Browse through the reports categorized by product and functional area.
6. Action Bar - Displays functionality available for the selected element. As you select an item on a management grid, the available functions are displayed.