Configure a Table in the SQL Template Designer
A table is the most basic chart used to represent data. Use the Move Up and Move Down feature to position the fields to easily select three fields.
Example of a Table SQL Template: Host Group Membership List
The following example reports on host group membership, in display name order.
1. In the SQL Template Designer, check only Host Groups and Client Scope.
2. In the Query window, enter the following select statement and click Validate Query:
SELECT g.group_name, s.server_id, s.display_name client,
s.hostname, s.ip_address
FROM apt_v_group_member m, apt_v_group g, apt_v_server s
WHERE g.group_id = m.group_id
AND m.child_type = 2 --Server (excludes children that are host groups)
AND m.child_id = s.server_id
AND s.server_id IN (${hosts})
ORDER BY s.display_name, g.group_name
3. In the Formatting window, select the fields to be displayed. For this example, it makes sense to select all and display the report as a Table.
4. Click Next, enter a report name and select a Menu Group. Then, click Finish.
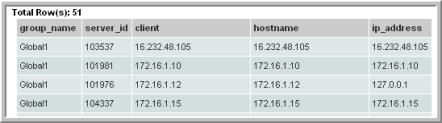
5. When you run this report, you can modify the scope to generate the report for a specific host group. The output will look something like this:
Note that the column header “client” was substituted for the field name, as specified in the query. You can specify similar substitutions using the Formatting window in the SQL Template Designer.
6. Since this query is ordered by display name and then group name, it may be more reasonable to display the output in a similar fashion. Use the Formatting tab to re-arrange the table columns (Move Up, Move Down). See
Format the SQL Template Output.
Example of a Table SQL Template: Exposed Clients
The following example lists the clients within the report scope that have not been backed up within the selected time frame.
1. In the SQL Template Designer, check both Date Range and Host Groups and Client Scope.
2. In the Query window, enter the following select statement and click Validate Query:
SELECT apt_v_job.client_id, apt_v_job.client_name, apt_v_job.server_id,
apt_v_job.server_name
FROM apt_v_job
WHERE apt_v_job.client_id IN (${hosts})
AND apt_v_job.summary_status IN (0,1) -- Success or Warning
HAVING MAX(start_date) < ${startDate}
GROUP BY apt_v_job.client_id, apt_v_job.client_name, apt_v_job.server_id,
apt_v_job.server_name
3. In the Formatting window, select the fields to be displayed. For this example, it makes sense to select all and display the report as a Table.
4. Click Next, enter a report name and click Finish.
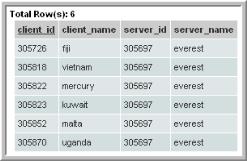
5. When you run this report, specify the start and end dates or a time period. So, for example, you could select Last 72 Hours and it will be substituted for startDate, listed in the query. You can modify the scope to generate the report for a specific host group. The output will look something like this: