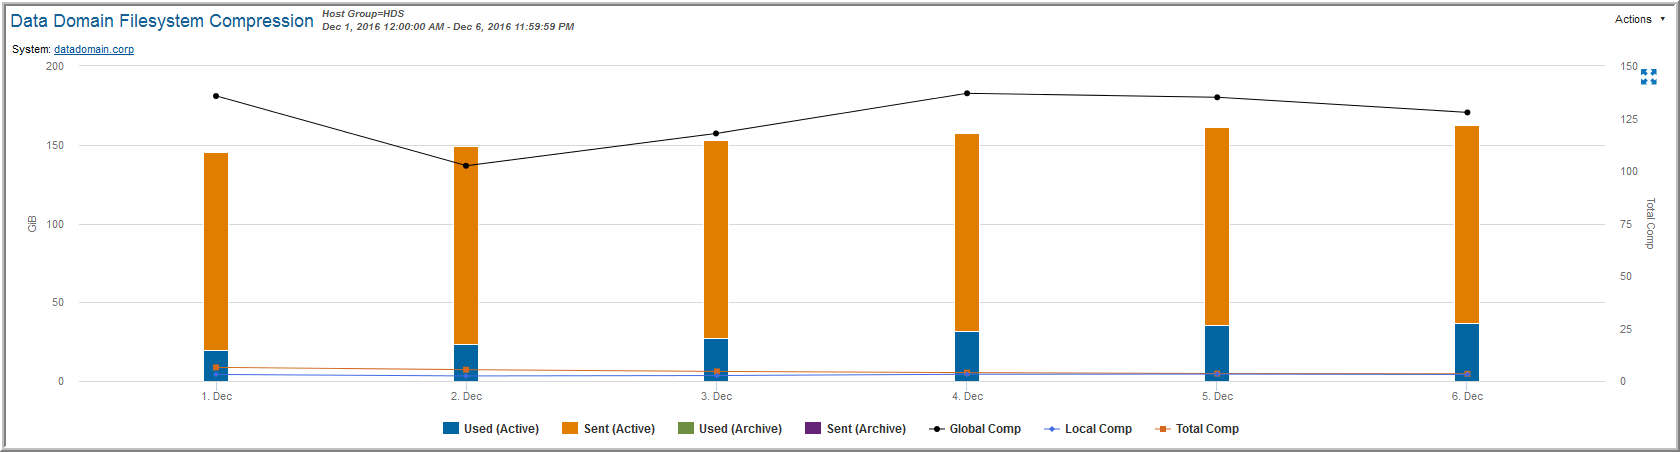
Used (Active) | Actual amount of space in use for the active tier. |
Sent (Active) | Amount of data sent prior to compression is represented by the yellow bar in the graph. |
Used (Archive) | Actual amount of space in use for the archive tier. |
Sent (Archive) | Amount of data sent for the archive tier is represented by the purple bar in the graph. |
Global Comp | Use this value to determine de-duplication efficiency. Represented by the triangle, the Global Compression factor is derived from the pre-compression (data sent before compression) divided by the size after de-duplication. |
Local Comp | The Local Compression factor (file compression) is represented by the circle. This value is derived from the size after de-duplication divided by the space used. |
Total Comp | Represented by the square, the Total Compression factor is derived from data sent divided by space used. |