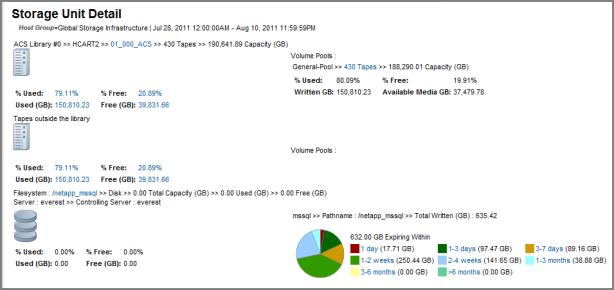

Tape Library | Click on a Library name link or the icon to go to the Tape Media Summary report for all media inside the library. In addition, various usage links launch the Tape Media Summary. Each library is accompanied by a media alert thermometer whose color is an indicator of the percentage of GByte availability for all media in the library:  |
Volume Group | Displays each library or group of tapes outside the library, and each has its own volume group. The media availability for the volume group is represented by a color coded thermometer so it is easy to tell whether there is a healthy amount of media GBytes available for future backups. |
Scratch Pool Media Usage | If there is a designated scratch pool for a Tape Library or Group of Tapes Outside the Library, the report display the scratch pool as a feeder pool to the Volume Pools. Each scratch pool is accompanied by a color‑coded scratch pool thermometer that indicates the amount of scratch media available. The value represented is a percentage: the capacity of the scratch media compared to the capacity all media in the library. |
Volume Pools | When there is a designated scratch pool, this displays all volume pools in that library that are fed by the scratch pool. Otherwise, the general pool is shown. Click on the number of tapes to view the Tape Media Summary report. |
Volume Pool Usage | Displays one or more volume pools, depending on how many exist in the library. Each volume pool has a pie chart that shows the % GBytes Free compared to the % GBytes Used. Click on any part of the pie chart or the Free and Used values to go to the Tape Media Summary report for that tape library. |
Filesystem | Displays details about the disk space of the media server’s filesystem on which the disk storage units reside. The operating system reports this data. Values of Unknown indicate that the Discovery module is not configured to probe the media servers’ filesystems for their physical characteristics. The management server and controlling server also are shown with the filesystem details. |
Storage Unit Usage | Shows the active backups on the Storage Unit grouped by expiration period. Click on a pie slice to go to the
Storage Unit Event Details, which displays a list of all the active backups within the particular expiration period. |
NetBackup Storage Units | |
Storage Unit | Indicates the NetBackup disk storage unit; links to the Storage Unit Images report. |
Disk Pool | Identifies the disk pool. |
Storage Server | The storage server for this storage unit. |
Status | Indicates the state of the disk pool, for example: Up. |
Flags | A list of the various flags that represent disk pool attributes. |
High Water Mark | This threshold triggers actions associated with a full volume: failed backup jobs, new jobs will not be assigned to a storage unit since the disk pool is full, and image cleanup is initiated. Default is 98%. |
Low Water Mark | This value has no effect for PureDisk volumes. |
Num Read Mounts | The number of times the volume was mounted for reads. |
Num Write Mounts | The number of times the volume was mounted for writes. |
Current Read Streams | Indicates the current number of read streams. |
Current Write Streams | Indicates the current number of write streams. |
Num Repl Sources | Indicates the number of replication source deduplication pools. |
Num Repl Targets | Indicates the number of targets for the duplication operations. |
Mounts | Lists the filesystem mounts. |