AWS Billing Summary Over Time
Explore your data center using APTARE customizable report templates or by using parts of your IT infrastructure as entry points. Use Search to find reports, templates and dashboards across the portal.
Use the Reports tab to examine the catalog of templates, dashboards and reports - organized by products along with user-created, and system folders. This report is located here:
Capacity Manager > Chargeback and Billing > AWS Billing Summary Over Time
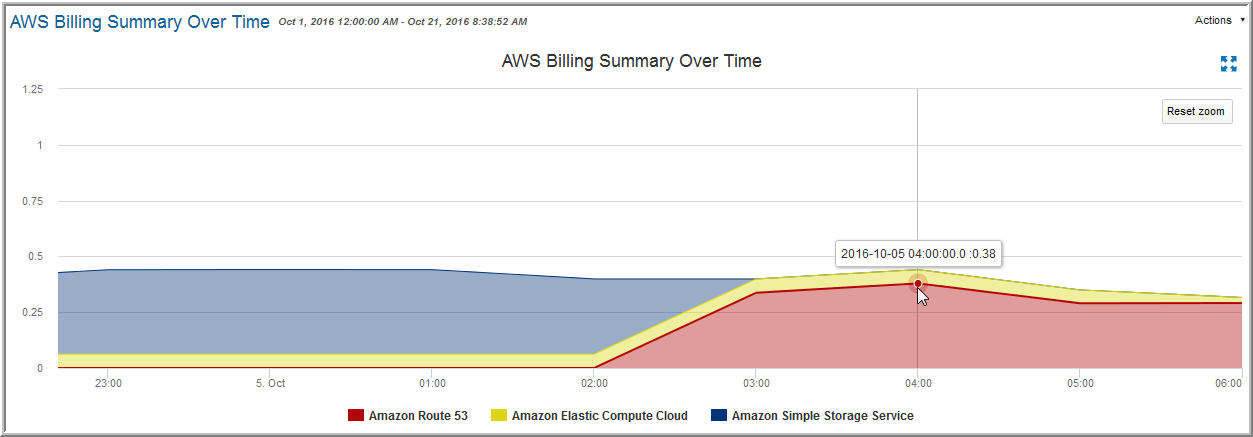
View a graphical representation of Amazon Web Services (AWS) total costs over time.
This chart breaks out the various cloud services. Click an area of the chart to access the AWS Account Billing Details. Hover your mouse over data points on the line to view costs for a specific date and time.
The report template uses following data to render the chart.
Product | Long name of the AWS product. |
Blended Cost | Cost for the operation listed in the line item based on the blended rate. |
Usage End Date | The end of the applicable charge period. All usage charges and recurring fees between the period start and end are included in your monthly invoice. |