Host Storage Usage Over Time
Explore your data center using APTARE customizable report templates or by using parts of your IT infrastructure as entry points. Use Search to find reports, templates and dashboards across the portal.
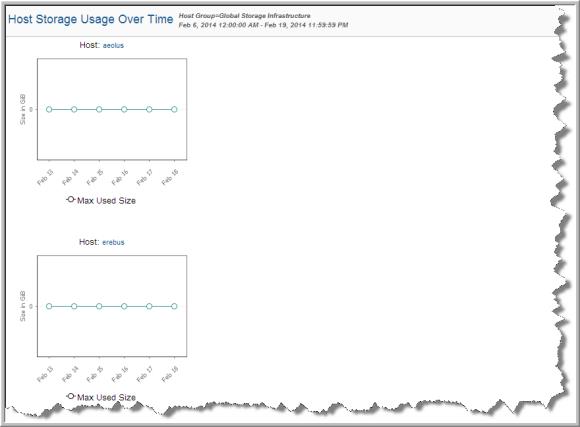
Use the Reports tab to examine the catalog of templates, dashboards and reports - organized by products along with user-created, and system folders. This report is located here:
Capacity Manager > Storage Capacity & Forecast > Host Storage Usage Over Time
Line charts, aggregated by Host Groups or Arrays, and grouped by a configurable time period, show allocated capacity over time. You can view a historical perspective on the amount of storage allocated to the ESX Clusters or Server Groups. This helps to illustrate the growth of your environment by ESX clustered or Host Group.
Use the Capacity Forecast report to project growth in storage usage. You can generate the report by the following criteria:
• Historical date range
• Forecast horizon (date range)
• Storage Type (SAN, DAS and NAS)
• Host Type
In addition, you can choose to generate graphs for each host or instead, display a consolidated graph for all the hosts selected in the scope selector.