Configure Chart Axes
For field types that have a field type of Bar or Line, additional elements need to be configured.
Tip: As a best practice, choose a bar chart that is provided as an out-of-the-box report template, then copy and customize it to see how it is configured.
1. In the Dynamic Template Designer window, once you have configured Selected Fields that have a Field Type of Bar, click Configure Charts at the bottom right of the window.
The Configure Charts option is not available under the following conditions:
• If the report type is a Table.
• If the report type is a Line Chart and has one or more groups defined in the template.
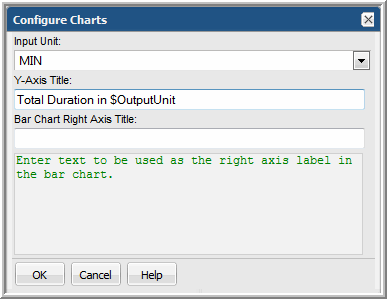
2. In the Configure Charts window, select an Input Unit that is relevant for the field values: KB, MB, GB, TB, Sec, Min, Hr, Day.
3. Enter text to be used as the Y-axis label in the bar chart. To append the output unit of measure, use $OutputUnit.
4. Enter text to be used as the right axis label in the bar chart.

