Interacting with Reports
Many interactive features are available depending on the report type:
• Time series - zoom and reset zoom: On a series of time-based data points, using the mouse, drag select a section of the chart to zoom. Click the Reset zoom button to return to your original settings.
• Time series – zoom and pan: Once you’ve zoomed on a series of time-based data points, you can scroll left and right through the chart. Hold down the shift key when panning.
• Expand to full screen: Charts displayed as components of a dashboard may be hard to read. Click the Expand icon to pop the chart out of the dashboard and have it displayed in the full browser window.
• Configure Portlets: Choose custom attributes for filters and switch positions for portlets on dashboard style displays.
• Show/hide data series: The legend displays the data series in a chart with a symbol and the name of the series. Click a value in the legend to add or remove the data point from the chart. The chart automatically updates based on the addition or removal.
• Column sorting: Click any column header on a tabular chart to sort the table by that column.
• Hyperlink drill downs: Drill down to a more granular level by clinking links in the report. This feature is available for all chart types.
• Time Period Quick Filters: Change the time period represented in the chart without formally editing the scope. Choose from 5 days, 2 days, 1 day, 12 hours, 4 hours or 1 hour.
• Expanding sectors: Click parts of a pie and donut charts to have sections emphasized without changing the data.
Report Type | Interactive Feature |
Tabular | • Hyperlink drill downs • Column sorting • Expand to full screen |
Bar (all types) | • Time series - zoom and reset zoom • Time series – zoom and pan • Expand to full screen • Show/hide data series • Hyperlink drill downs |
Line | • Time series - zoom and reset zoom • Time series – zoom and pan • Expand to full screen • Show/hide data series • Hyperlink drill downs |
Area | • Time series - zoom and reset zoom • Time series – zoom and pan • Expand to full screen • Show/hide data series • Hyperlink drill downs |
Pie/Donut | • Expand to full screen • Show/hide data series • Hyperlink drill downs • Expand sectors |
Gauge | • Expand to full screen |
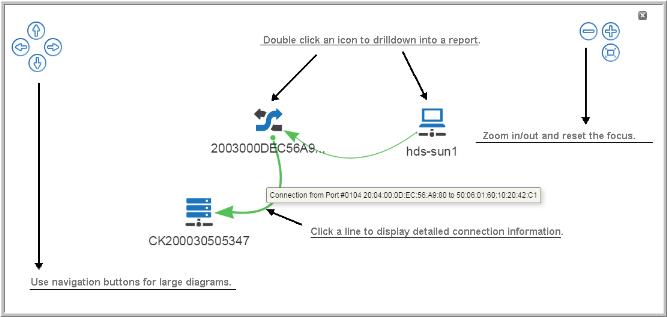
Working with Topology
Connectivity between objects is shown in a topology diagram. Each object displays the type and the count.
• Mouse-over each device (host, switch, storage array) and paths to view details
• Single click a connection to view the details
• Double click a device to display detailed reports
• Expand the topology window to zoom and navigate through larger diagrams.