About the Reports Tab
The
Reports tab is a management window into your reporting catalog, allowing you to browse through and manage APTARE IT Analytics templates, reports and dashboards. You can quickly identify when new/updated templates are introduced and choose to update or not. You can view the mappings between reports and templates, if sharing is enabled, detailed report descriptions and other information. On the management side, you can create, edit, and delete reports, plus organize them into a folder structure that is relevant to your business. See also
Templates, Reports, and Dashboards Overview.
Report Tab Basics
Navigating through reports is made easy through the use of tabs to display functionality. This functionality is only available in the Reports view.
There are a few basic navigation features that are important to know:
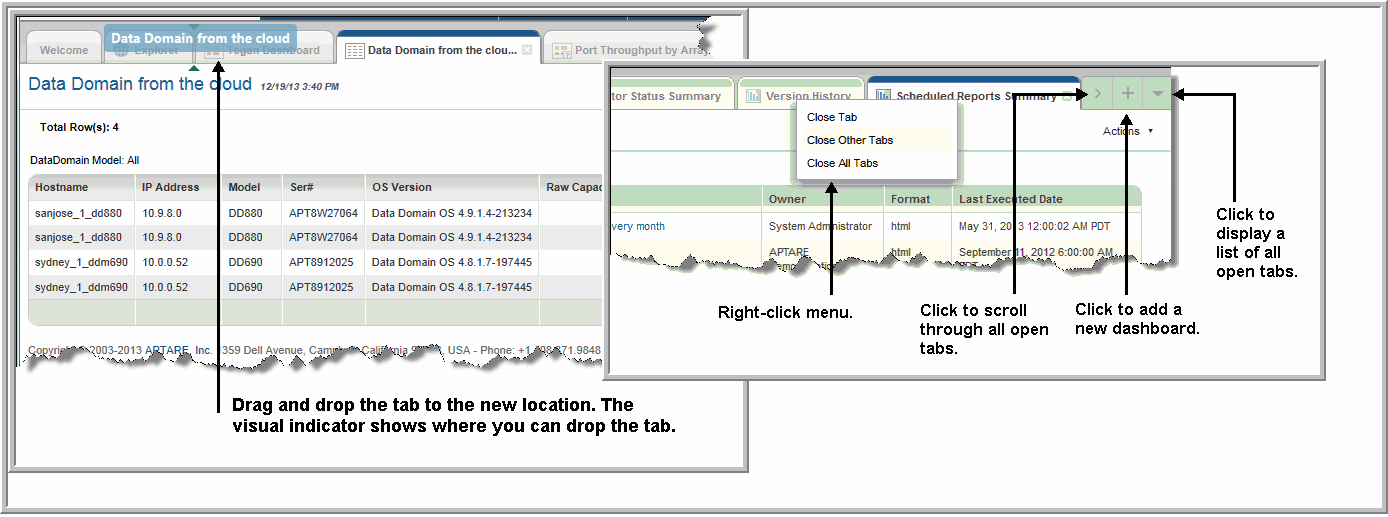
Scrolling through tabs - As the number of opened tabs increases, a scrolling icon is displayed on either side of the page. This icon allows you to move quickly through your open tabs, even if they are not visible on the page.
Changing the tabs order - To move a tab to a different place on the tab strip, drag it using your mouse. While you’re dragging a small indicator shows where the tab will land.
Show tab list - As many tabs are opened, the browser will become filled with tabs and some will not be visible on the page. At this point, an arrow at the far right of the tabs enables a selection of the full list of open tabs.
New Dashboard - A tab with a plus icon is always displayed to create a new dashboard, as required.
Closing one or all tabs - You can close all tabs at once, close a single active tab, or close all tabs but the active one by right-clicking directly on top of a tab.

