Capacity Architecture Overview
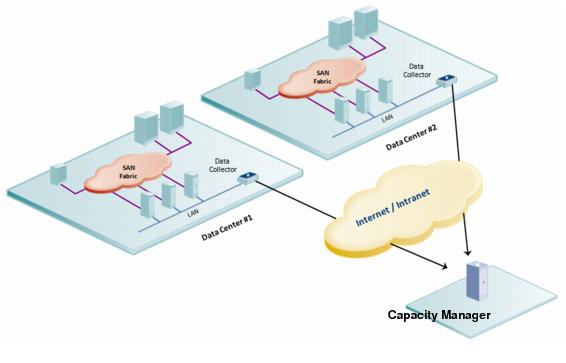
Capacity Manager provides end-to-end storage capacity reporting from the hosts to the storage arrays. The Data Collector is a software component that is responsible for interfacing with one or many storage arrays for information related to the capacity management environment. In most cases, the Data Collector software module can reside on any server within your network that is Java 1.8 compatible and, where applicable, has a working copy of specific storage array command line utilities already installed. The exception is EMC Symmetrix, which requires the Data Collector to reside on the server that manages the arrays. The following diagram illustrates how the Capacity Manager Data Collector could be deployed in your environment:
Figure 1.1 Data Collector for Capacity Manager
The Data Collector obtains all of its monitoring rules from a configuration file maintained in the database. This file is called the Data Collector Configuration File and is stored in the database in XML format. When the Data Collector is first started, it downloads the Data Collector Configuration File from the database. The Data Collector uses this file to determine the list of storage arrays that are to be monitored and included in its data polling.
In most cases, a single instance of the Data Collector can support any number of storage arrays. The only real limitation is the memory and CPU processing power of the server on which the Data Collector resides. For each storage array, the Data Collector will establish connections to the database. The Data Collector Configuration file contains all the connection information for each server including such parameters as the host name / IP address of the server.
The Data Collector communicates with the storage array’s system service processor (SSP) to gather storage capacity data. The information is then sent via http(s) to the Portal. Users can then access the Portal via a web browser.
Which Data Collector Policies Are Needed?
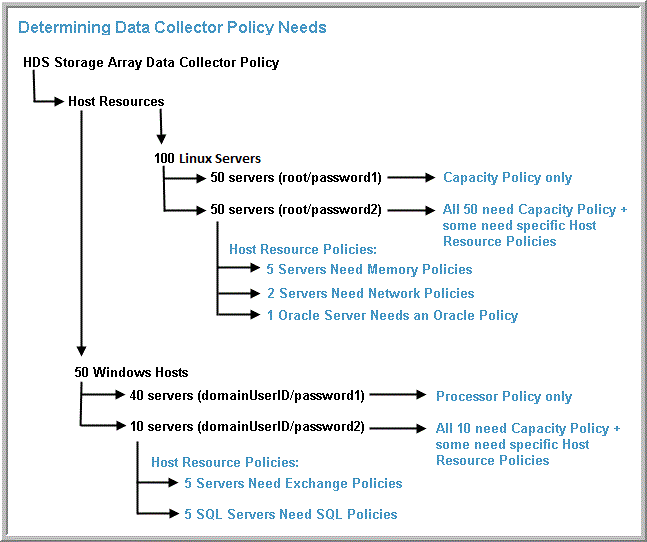
Policies need to be configured via the Portal to establish communication with the installed Data Collectors. The following example illustrates a typical Capacity Manager deployment for array and host data collection.
In this example of 100 Linux servers:
• 50 servers will have only capacity information collected
• Another 50 servers will have capacity information collected, plus some of those servers will also have Host Resources data collected:
• 5 Memory
• 2 Network
• 1 Oracle Server
Array Performance Data Collection Prerequisites
The following array families are supported for block storage LUN performance and port performance data collection.
LUN Performance Metrics
Array Family | Read/Write IO/sec | Total IO/sec | Read/Write
MB/sec | Read/Write Cache Hits/sec | Read/Write Response (ms) | Total Response (ms) | Notes |
Dell Compellent | X | X | X | X | -- | -- | |
EMC VNX (CLARiiON) | X | Calculated | X | X | X | Calculated | For CLARiiON arrays: The minimum FLARE OS version required to capture response times is 04.30.000.5.524 A11. Note that VNX (Block) will have completely different FLARE releases and all support the collection of the counter fields needed for capturing response time, starting with FLARE version 05.31.000.5.006 A01. Enable statistics logging on the VNX system. |
EMC Symmetrix | X | X | X | X | -- | -- | |
EMC XtremIO | Calculated | Calculated | Calculated | -- | X | X | For EMC XtremIO, the values obtained are averages over the time interval. The Read/Write/Total IOs and the Read/Write MBs are multiplied by the time interval and persisted. |
HDS Tuning Manager | X | Calculated | X | X | X | X | For Hitachi arrays: To collect performance data from Hitachi Tuning Manager, the Data Collector must be installed on the same server as Tuning Manager. And, a single Data Collector policy must be used to collect both the capacity data from the Device Manager server and the performance data from the Tuning Manager server. |
HP 3PAR | X | X | X | X | X | X | |
IBM SVC | X | X | X | -- | -- | -- | |
IBM XIV | X | X | X | X | X | X | |
NetApp ONTAP 7-Mode (Block only) | X | Calculated | X | -- | -- | Avg Latency | For NetApp ONTAP 7-Mode (Block only): Total response time is the average latency (ms) for all LUN read and write operations. Performance data is collected for both iSCSI LUNs and FC LUNs. |
Pure Storage FlashArray | X | Calculated | X | -- | X | Calculated | |
Port Performance Metrics
Array Family | Read/Write MB | Total MB | Read/Write I/O | Total I/O | Notes |
Dell Compellent | X | Calculated | -- | X | For Dell Compellent: Only Fibre Channel port statistics are collected. |
EMC VNX (CLARiiON) | Not Supported | Not Supported | Not Supported | Not Supported | |
EMC Symmetrix | -- | X | -- | X | |
EMC XtremIO | -- | Calculated | -- | Calculated | |
HDS Tuning Manager | X | X | X | X | |
HP 3PAR | X | Calculated | -- | X | |
IBM SVC | Not Supported | Not Supported | Not Supported | Not Supported | |
IBM XIV | X | X | X | X | |
NetApp ONTAP 7-Mode (Block only) | X | Calculated | -- | -- | |
Calculated = Calculated from collected data, X = Collected from the array, -- = Not Collected


