NetApp Aggregate Detail
Detail reports are related to a specific enterprise object, such as a backup job or SAN fabric. You can only access detail reports through a link presented in the context of a main report, providing additional information that augments the main report. Detail reports cannot be generated, customized, or saved, as they are specific to the report from which they were derived. They are not available in search results.
Explore your data center using APTARE StorageConsole customizable report templates or by using parts of your IT infrastructure as entry points. Use Search to find reports, templates and dashboards across the portal.
Use the Reports tab to examine the APTARE StorageConsole catalog of templates, dashboards and reports - organized by products along with user-created, and system folders. The main report is located here:
Capacity Manager > Array Capacity & Utilization > Array Capacity & Utilization
Next, click # Aggregates.
Click an Aggregate Name link.
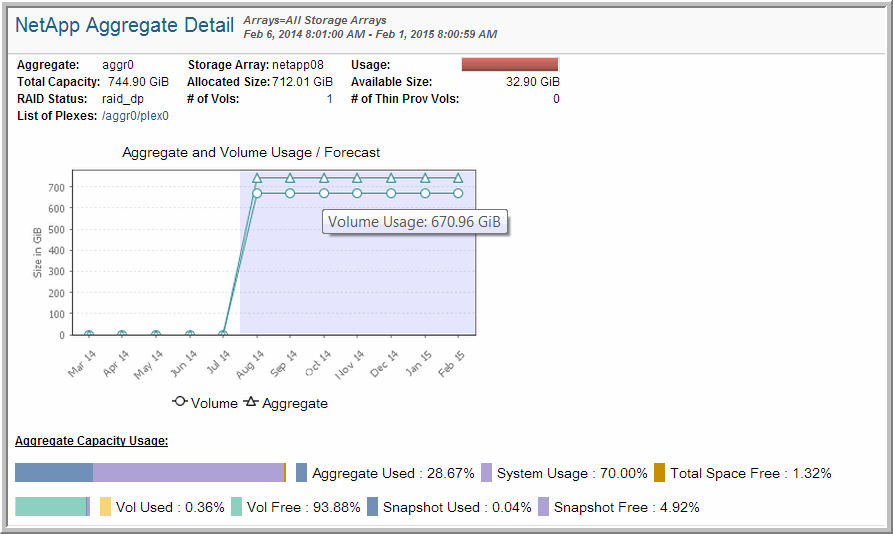
The Aggregate Detail forecasts usage, based on historical data. Mouse over the Aggregate and Volume usage symbols to view the historical and projected usage.
Aggregate Capacity Usage
At the bottom of the window, the cascade of usage bars illustrates the logical subsets of the aggregate.
• Mouse over the colored bar segments to view the actual values instead of the percentages.
Aggregate | Name of the NetApp aggregate. Drill down to NetApp Volumes at Risk. |
Total Capacity | Total size (in bytes) of the file system. If the file system is restricted or offline, this value is 0. |
RAID Status | RAID status - comma separated list of values. |
List of Plexes | Lists 1 or 2 Plexes—2 if SyncMirror is licensed and enabled. Links to the NetApp Plex Details report. |
Storage Array | |
Allocated Size | Number of bytes used in the file system. If the file system is restricted or offline, this value is 0. Values are stored as KiB in the database and rendered according to your user profile preferences. |
# of Vols | Number of volumes in the aggregate. Drill down to NetApp Volume Summary. |
% Usage of Aggregate | Usage = Allocated Size / Total Capacity |
Available Size | Available bytes in the aggregate. |
# of Thin Prov Vols | Number of thin provisioned volumes in the aggregate. |

