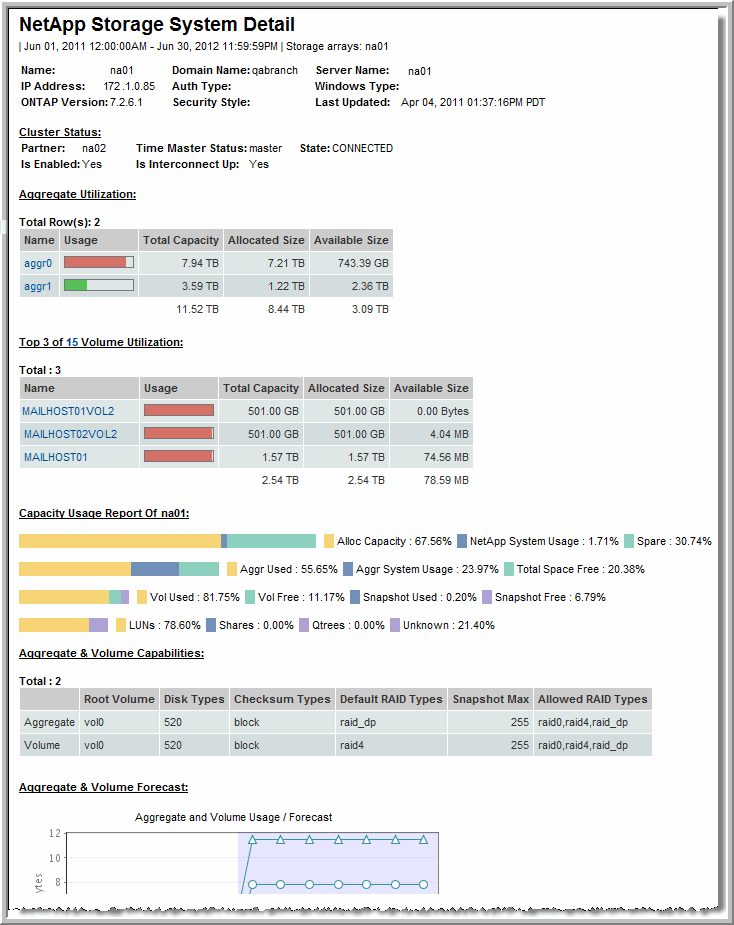

Name | Name of the NetApp storage |
IP Address | IP address of the storage unit |
ONTAP Version | Version of the NetApp ONTAP operating system |
Domain Name | The DNS domain name |
Auth Type | Indicates the type of authentication: ad - Active Directory, nt4 - Windows NT4, workgroup - Workgroup, passwd - Password file, NIS, or LDAP |
Security Style | NTFS or Multiprotocol |
Server Name | Server name |
Windows Type | Windows software version |
Last Poll Time | Last time the portal database was updated with data collected from the NetApp system |
Partner | The associated storage filer in the cluster |
Time Master Status | Master or Slave within the cluster |
State | Cluster State - Connected/Disconnected |
Is Enabled | Y or N to indicate enabled state |
Is Interconnect Up | Y or N to indicate connectivity |
Aggregate Utilization | The thermometers and capacity information provide a sub-set of the information that is available in the NetApp Aggregate Summary. Drill down on the “Top 3 of n Aggregate Utilization” to see additional aggregates: Name, Usage, Total Capacity, Allocated Size, and Available Size. |
Volume Utilization | The thermometers and capacity information provide a sub-set of the information that is available in the NetApp Snapshot Summary. Drill down on the “Top 3 of n Volume Utilization” to see additional volumes: Name, Usage, Total Capacity, Allocated Size, and Available Size. |
Capacity Usage Bar Charts | A cascade of bar charts represents usage by: Array - Displays total capacity, the amount used by system overhead, and spare capacity. Aggregate - Of the total capacity, what is used by the aggregate. Volume - Volume usage, including specific snapshot details, and LUN/Shares/QTrees |
Root Volume | The name of the current root volume of the NetApp storage array |
Disk Types | Disks supported by this NetApp array. Possible values include 512 (if all disks are 512 bps), 520 (if all disks are 520 bps), mixed (if disks are a mix of 512 and 520 bps), none (if no disks are 512 or 520 bps). |
Checksum Types | Possible values: zoned (fixed VBN), block (block appended), or mixed |
Default RAID Types | Possible values include raid0, raid4, raid_dp. |
Snapshot Max | Maximum number of snapshots available per aggregate |
Allowed RAID Types | List of allowed RAID types |