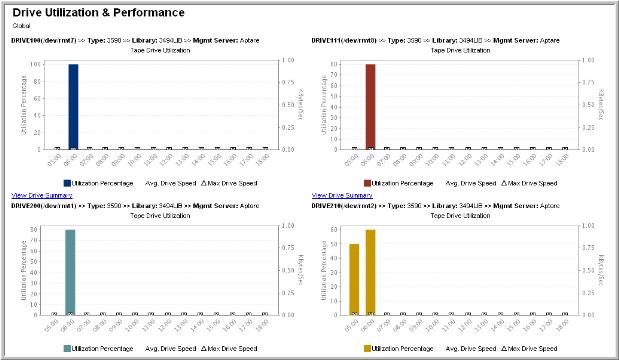
Drive Details | For each drive, listed at the top of each Drive Utilization and Performance Chart: • Drive Name • Drive Type • Tape Library Name • Backup Management Server Click on the Backup Management Server name to view its Host Details page. |
Pop-up Details | Mouse‑over any chart bar or line symbol to view the corresponding values. |
Drive Summary | Click on the list at the bottom of each chart to go to the Drive Performance Summary Report, which lists all the backup events that took place on that drive for the time period that you specified in the report scope. Additionally, the min, max, and avg KBytes/Sec for the time period are provided at the bottom of the report. |
Avg & Max KBytes/Sec | The Avg KBytes/Sec and Max KBytes/Sec is displayed for every bar during which an event completed. If the report shows a bar with utilization but does not have accompanying line symbols, either no backups or restores completed during that time period or the drive was being utilized for another purpose, such as copying a tape to be vaulted. |
Local Start and End Times | Each chart displays the utilization and performance of one drive in the system. The start and end time for each chart is localized to the time zone where that drive’s management server is located. For example, if Drive A’s management server is located in the Pacific Standard Time Zone and Drive B’s management server is located in the Eastern Standard Time Zone (3 hours ahead of Drive A’s management server) and you ran the Drive Utilization and Performance Report for the last 12 hours, the Drive A chart’s start and end times would be 3 hours earlier than the chart for Drive B. This start/end time localization enables real time performance comparison between drives, even if they are located in different parts of the world. |