Report | Description |
Job Summary by Server | Displays the number of jobs and the job status for the time period that you selected in the report scope: You can drill down on any non-zero value to view the Job Summary Report for those corresponding jobs. Additionally, you can drill down further to the more comprehensive Job Detail Report for any individual jobs listed in the summary. |
Real Time Library and Drive Status | Summarizes each tape library in your environment. The data will only be as current as the time of the most recent poll of your management server(s) by the Data Collector. Monitor the health of each library by tracking the number of drives up, down, in use and available within each tape library. When the number of down drives in a library is equal to or greater than 25%, the text for the library’s row is flagged in red. |
Real Time Storage Unit Utilization | The Real Time Storage Unit Component displays current high-level information for each storage unit in your environment. Each storage unit listed provides you with several columns of pertinent information. 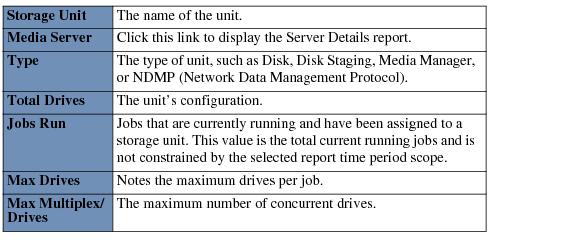 The Drives Up column combined with the Jobs Queued and Jobs Running columns help you determine whether a storage unit is functioning properly. For instance, if there are jobs in the queue for a storage unit, and there are also drives available within a storage unit, there may be something preventing the queued jobs from moving to the running status. |
Running and Queued Jobs Summary | Displays any job that was running or queued at the time the Data Collector last polled the management server(s). Click any Job ID # in the list to retrieve comprehensive detail about a specific job. The total number of running jobs displayed on the dashboard is limited. If the number of running and queued jobs exceeds the limit, all the running and queued jobs can be viewed in a separate report by clicking the Total Running and Queued Jobs link. The following jobs require attention, so the report highlights them in red and moves them to the top of the running and queued jobs list. Each of these flagged jobs will be accompanied by one or more icons to indicate the potential problem: 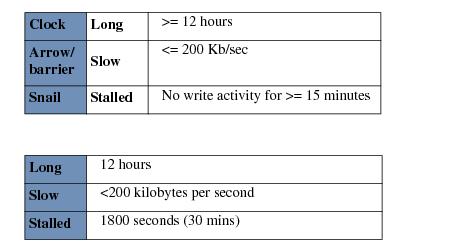 |