Client Job Histogram
Use Search to find a template, report or dashboard by name. Search is case insensitive, supports partial entries, and will display a list of potential matches.
As you enter the name in the Search field, up to 10 potential matches are displayed. If the template, report or dashboard is shown, you can select and run it directly from the match list. You can also click All Items in the match list to go directly to the Search Results.
StorageConsole provides different navigation options to slice and examine your collected data. You can explore the data by using the APTARE customizable report templates or by using parts of your IT infrastructure as entry points. The Inventory Navigator serves as a browser for your infrastructure by object type.
Use the Reports tab to examine the StorageConsole catalog of templates, dashboards and reports - organized by products along with user-created, and system folders. This report is located here:
Backup Manager > Administration Reports > Client Job Histogram
From the Client Job Histogram Report Designer, you can select one of the following options:
• Job Throughput Histogram
• Job Activity Histogram
These reports provide hour-by-hour data for the previous 24-hour period.
Using these reports, you can identify bottlenecks and adjust your environment accordingly.
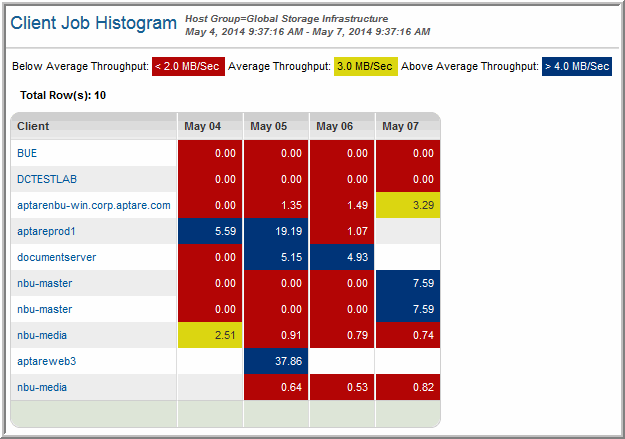
Job Throughput Histogram
This report provides colored visual cues for quickly determining the backup throughput trends for clients that had backup jobs within the previous 24 hours. This report shows completed jobs that started within the selected time period. These jobs could have a completion status of either successful or warning.
• Red - Indicates below average throughput—less than 5 MB/second
• Yellow - Indicates average throughput—greater than 5 MB/second and less than 9 MB/second
• Blue - Indicates above average throughput—greater than 9 MB/second
Note: The breakdown is based on the average, not the mean throughput.
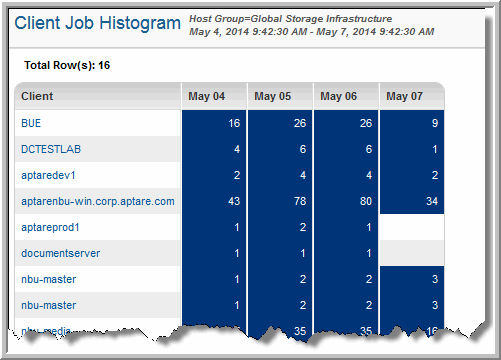
Job Activity Histogram
The Job Activity Histogram lists clients that had backup jobs within the previous 24 hours. The colored cells enable you to quickly determine the activity per client.
The report shows the number of completed jobs that started within the selected time period. These jobs could have a completion status of: successful, failed, or warning.