Job Status Summary
Use Search to find a template, report or dashboard by name. Search is case insensitive, supports partial entries, and will display a list of potential matches.
As you enter the name in the Search field, up to 10 potential matches are displayed. If the template, report or dashboard is shown, you can select and run it directly from the match list. You can also click All Items in the match list to go directly to the Search Results.
StorageConsole provides different navigation options to slice and examine your collected data. You can explore the data by using the APTARE customizable report templates or by using parts of your IT infrastructure as entry points. The Inventory Navigator serves as a browser for your infrastructure by object type.
Use the Reports tab to examine the StorageConsole catalog of templates, dashboards and reports - organized by products along with user-created, and system folders. This report is located here:
Backup Manager > Management Reports > Job Status Summary
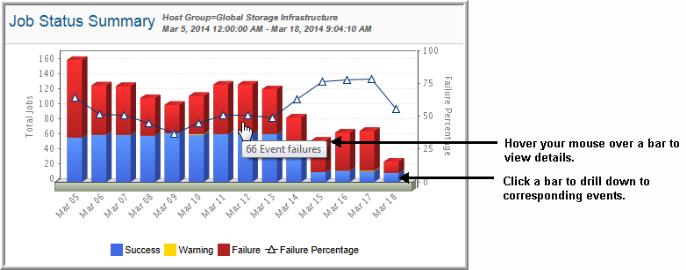
The Job Status Summary report shows a bar chart that aggregates jobs that succeeded, failed, or produced warning messages. This high-level summary provides drilldown access to the Job Summary report, where you’ll find specific status messages and scheduling information.
When you generate this report, several Report Designer options enable you to narrow the scope of the report and also to define how the data will be displayed. Refer to the APTARE StorageConsole User’s Guide for Capacity Manager Primary Settings and Backup Manager Primary Settings. In particular, note the Parent Job Only, Ignore Retries, and Backup Window settings that are available for this report.
Use this procedure to track down backup failure details:
1. View the Job Status Summary report.
2. Click on the top section of a bar in the bar chart to drill down to details.
The top portion of the bar indicates backup error events, the middle section reports event warnings, and the bottom represents successful backups. Note that often the partial backups represent your biggest exposure, so drilling down on the warning events can help you identify and resolve issues.
When you drill down to details, you are launching the
Job Summary Report.
3. In the Job Summary report, view the Activity Type column for backup log messages.
4. In the J
ob Summary report, click on the
Finish Date to view the
Job Details Report, which shows additional message-log entries. Be sure to scroll down to the bottom of the list to find backup attempts and notes related to the job.
Related reports:
• Job Summary Report. This tabular report provides details related to the data represented in the bars shown in the
Job Status Summary chart. You can drill down to the job summary details from the
Job Status Summary bar chart.
• Backup Status SLA. In addition to job status, this report provides indicators showing a trend line of event successes.
The Job Status Summary provides the following information:
Drillable Stacked Bar Chart | Click on any of the bar sections to go to a Job Summary Report for the backups corresponding to the time period and event status for the bar that you selected. The top portion of each bar indicates backup error events, the middle section reports event warnings, and the bottom section represents successful backups. |
Pop-up Details | Mouse‑over any of the bars or symbols on the chart to display pop-ups that provide details. |
Job Failures | The triangle symbol in the chart tracks to the right y-axis and provides at‑a‑glance backup performance statistics—specifically, it reports the event failures as a percentage of the total events for the selected time period. |