AWS EC2 Instance Summary
Use Search to find a template, report or dashboard by name. Search is case insensitive, supports partial entries, and will display a list of potential matches.
As you enter the name in the Search field, up to 10 potential matches are displayed. If the template, report or dashboard is shown, you can select and run it directly from the match list. You can also click All Items in the match list to go directly to the Search Results.
StorageConsole provides different navigation options to slice and examine your collected data. You can explore the data by using the APTARE customizable report templates or by using parts of your IT infrastructure as entry points. The Inventory Navigator serves as a browser for your infrastructure by object type.
Use the Reports tab to examine the StorageConsole catalog of templates, dashboards and reports - organized by products along with user-created, and system folders. This report is located here:
Virtualization Manager > Administration Reports > AWS EC2 Instance Summary
Access an at-a-glance view of each Amazon Web Services (AWS) Elastic Cloud Compute (EC2) instance.
Each instance includes relevant data, such as Elastic Block Store (EBS) usage and the current month-to-date cost.
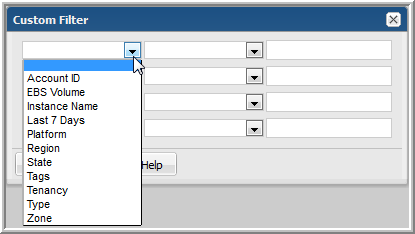
Use the Custom Filter in the scope selector to isolate specific types of AWS data.
Instance Name | AWS Instance Name. |
Account ID | The AWS account ID, a 12-digit number. |
Region | Specifies the region in which an AWS object exists. |
Zone | Specifies the Availability Zone in which an AWS object resides or a charged usage occurred. |
Type | Type of instance (determines the instance CPU, capacity, memory, and storage). |
Platform | Platform of the guest (blank if not Windows). |
Tenancy | The EC2 instance tenancy type, such as dedicated or shared. |
EBS Volume | EBS Volume |
Tags | Tags associated with the instance. |
Launched | When the instance was launched. |
Last Updated | Last updated date. |
State | Instance state, such as stopping or running. |
Blended Cost | Cost for the operation listed in the line item based on the blended rate. |
Last 7 Days | The sparkline chart represents the cost over the seven days prior to the end date of the report’s scope. |