LUN Performance
Use Search to find a template, report or dashboard by name. Search is case insensitive, supports partial entries, and will display a list of potential matches.
As you enter the name in the Search field, up to 10 potential matches are displayed. If the template, report or dashboard is shown, you can select and run it directly from the match list. You can also click All Items in the match list to go directly to the Search Results.
StorageConsole provides different navigation options to slice and examine your collected data. You can explore the data by using the APTARE customizable report templates or by using parts of your IT infrastructure as entry points. The Inventory Navigator serves as a browser for your infrastructure by object type.
Use the Reports tab to examine the StorageConsole catalog of templates, dashboards and reports - organized by products along with user-created, and system folders. This report is located here:
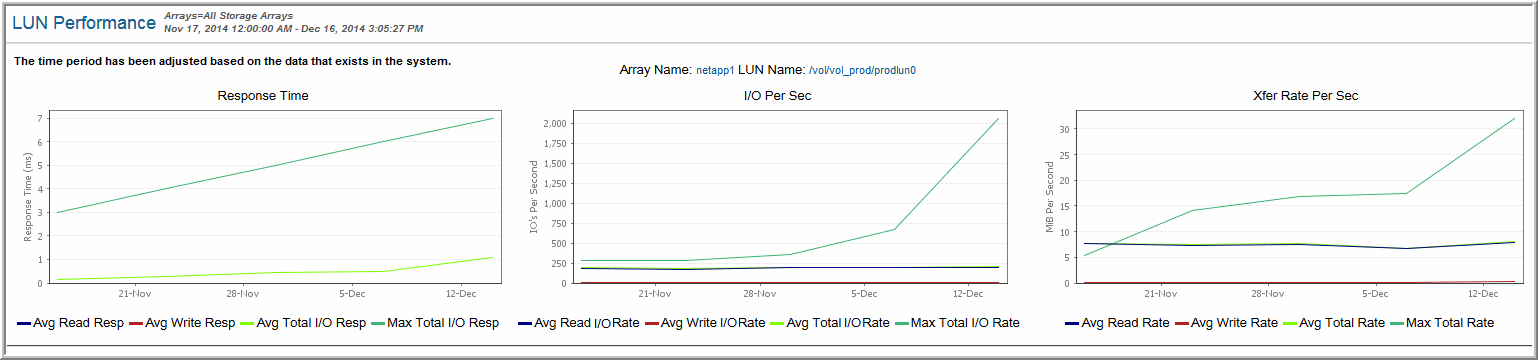
Capacity Manager > Storage Performance > LUN Performance
Graphs for the selected report time period represent the following LUN performance statistics:
• Response Time: Average Read, Average Write, Average Total I/O, and Maximum Total I/O
• I/O’s Per Second
• Read/Write Rates
Note: Array LUN performance response times (total, read, write) are not provided in reports for the following array families: EMC Symmetrix, Dell Compellent, and HP 3PAR.
Select the lines to be represented in the charts. Click the Array Name link to view the Array Capacity & Utilization report. Click the LUN Name link to view the LUN Utilization Summary.