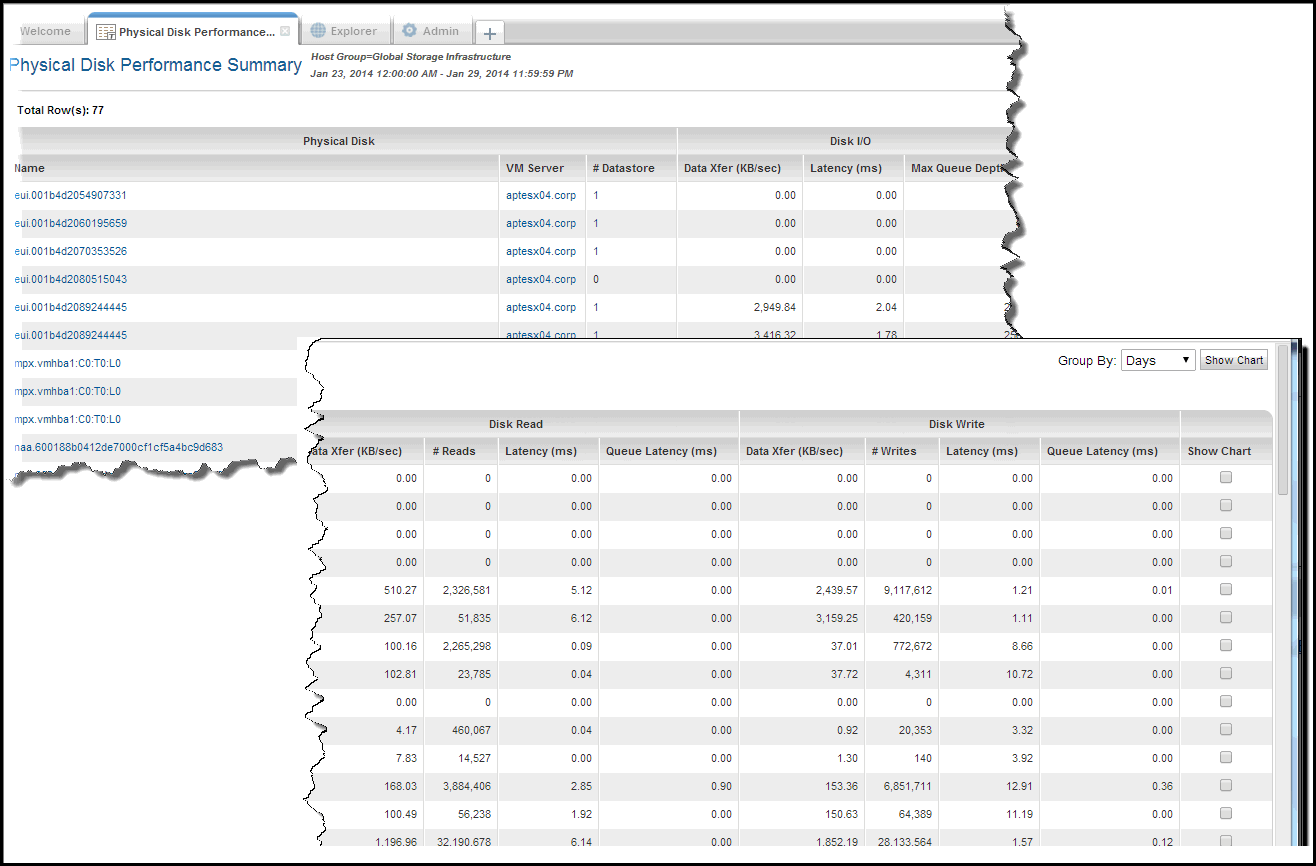

Physical Disk Name | Disk name links to the Physical Disk Detail. |
VM Server | VM Server links to the VM Server Detail. |
# Datastore | Number links to the Datastore Utilization Summary. |
Disk I/O Data Xfer (KB/sec) | Disk I/O transfer rate. |
Disk I/O Latency (ms) | Disk I/O wait time, which is the average for the report’s Group By interval. |
Disk I/O Max Queue Depth | Disk I/O maximum queue depth. |
Disk Read Data Xfer (KB/sec) | Disk read transfer rate. |
Disk Read # Reads | Sum of the number of disk reads for the report’s Group By interval. |
Disk Read Latency (ms) | Disk read wait time, which is the average for the report’s Group By interval. |
Disk Read Queue Latency (ms) | Average amount of time taken during the collection interval per SCSI read command in the VMKernel queue. |
Disk Write Data Xfer (KB/sec) | Disk Write transfer rate. |
Disk Write # Writes | Sum of the number of disk writes for the report’s Group By interval |
Disk Write Latency (ms) | Disk write wait time, which is the average for the report’s Group By interval |
Disk Write Queue Latency (ms) | Average amount time taken during the collection interval per SCSI write command in the VMKernel queue. |
Show Chart | Check the boxes for which you want to generate charts. See also Show Chart Parameter. |