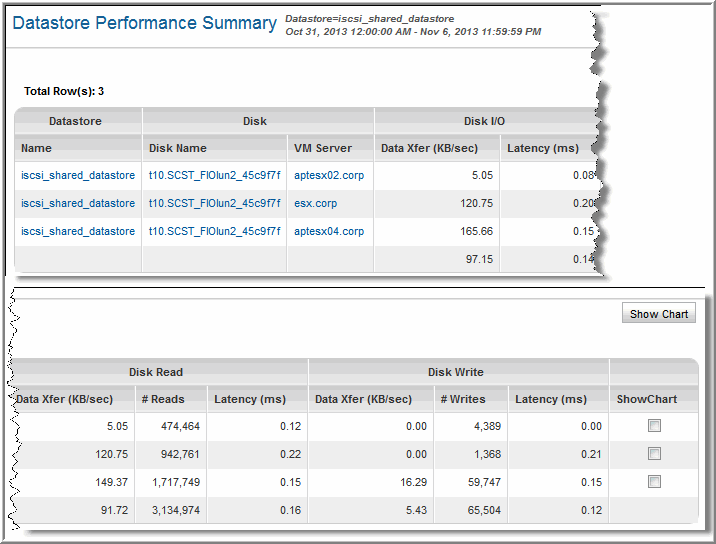

Datastore Name | Datastore name links to Datastore Detail |
Disk Name | Disk name links to the Physical Disk Detail |
VM Server | VM Server links to the VM Server Detail |
Disk I/O Data Xfer (KB/sec) | Disk I/O average (read xfer and write xfer) for all disks; the total for this column is the sum of the read and write averages |
Disk I/O Latency (ms) | Disk I/O wait time, which is the average for the report’s Group By interval; Disk Read and Write Latency is available only for ESX Hosts (not VMs). Therefore, latency performance charts are available only for partitions of Type=Host |
Disk Read Data Xfer (KB/sec) | Average disk read transfer rate for the report’s Group By interval |
Disk Read # Reads | Sum of the total number of disk reads for the report’s Group By interval |
Disk Read Latency (ms) | Disk read wait time, which is the average for the report’s Group By interval; Disk Read and Write Latency is available only for ESX Hosts (not VMs). Therefore, latency performance charts are available only for partitions of Type=Host |
Disk Write Data Xfer (KB/sec) | Average disk write transfer rate for the report’s Group By interval |
Disk Write # Writes | Sum of the total number of disk writes for the report’s Group By interval |
Disk Write Latency (ms) | Disk write wait time, which is the average for the report’s Group By interval; Disk Read and Write Latency is available only for ESX Hosts (not VMs). Therefore, latency performance charts are available only for partitions of Type=Host. |
Show Chart | Check the boxes for which you want to generate charts. Disk Read and Write Latency is available only for ESX Hosts (not VMs). Therefore, latency performance charts are available only for partitions of Type=Host. See also Show Chart Parameter. |