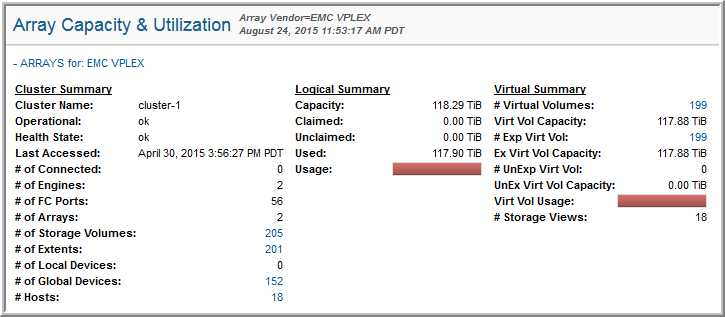

Cluster Summary | |
Cluster Name | Name of the cluster. |
Operational | Operational status: degraded, isolated, ok, or blank. |
Health State | Indicates the health of the cluster. |
Last Poll Time | The date and time of the last successful data collection cycle. |
# of Connected | Number of clusters to which this cluster is connected. |
# of Engines | Number of engines: 1, 2, or 4. Each engine includes 2 directors, each having x4 8G FC front-end ports and x4 8G FC back-end ports. |
# of FC Ports | Number of fibre-channel ports in the VPLEX instance. |
# of Arrays | Number of back-end connected arrays. |
# of Storage Volumes | Number of back-end storage volumes. |
# of Extents | Number of extents. |
# of Logical Devices | Number of local devices with local visibility, available to the VPLEX cluster. |
# of Global Devices | Number of local devices with global visibility, available to resident or remote VPLEX clusters. |
# Hosts | Number of hosts associated with this cluster. Drill down to the Host Capacity & Utilization report. |
Logical Summary | |
Capacity | Total capacity of all Storage Volumes (Unclaimed, Claimed, and Used). |
Claimed | Total capacity of all Storage Volumes Claimed. |
Unclaimed | Total capacity of all Storage Volumes Unclaimed. |
Used | Total capacity of all Storage Volumes Used |
Usage | A progress bar (red, yellow, green) indicates usage, based on Used/Capacity. |
Virtual Summary | |
# Virtual Volumes | Number of all Virtual Volumes managed by this instance. |
Virt Vol Capacity | Total capacity of all Virtual Volumes managed by this instance. |
# Exp Virt Vol | Number of all Virtual Volumes managed by this instance, exported to hosts. |
Ex Virt Vol Capacity | Total capacity of all Virtual Volumes managed by this instance, exported to hosts. |
# UnExp Virt Vol | Number of all Virtual Volumes managed by this instance, un-exported to hosts. |
UnEx Virt Vol Capacity | Total capacity of all Virtual Volumes managed by this instance, un-exported to hosts. |
Virt Vol Usage | A progress bar (green/yellow/red) indicates usage, based on UnEx Virt Vol Capacity/Virt Vol Capacity. |
# Storage Views | Total number of Storage Views on this instance of VPLEX. |