Using this report, you can identify applications that are at risk of running out of storage space. Identify which applications are expected to run out of storage and when.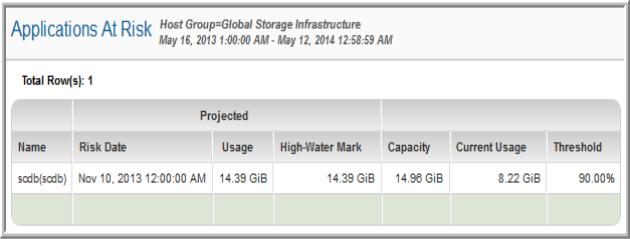
Name | The application at risk. |
Risk Date | The first date of the period for which the usage is projected.The risk date is based on the historical growth of the application’s usage. |
Usage | The projected usage based on the average usage history (or historical average usage for periods in history). |
Projected High-Water Mark | The projected maximum usage based on historical average usage. |
Capacity | The database capacity. |
Current Usage | Database storage already in use. |
Threshold | If a threshold has been set for a particular application—that is, a database threshold—then that threshold is used to determine the risk. If there is no threshold associated with the application’s database, then other thresholds are checked, in the following sequence: Host for the associated LUN/Filesystem/Database, then Host group to which the host belongs, and then the Top-level, global host group. If no threshold settings are found at the above levels, the system defaults are used: 90% for Critical, 70% for Warning, and 30% for Low. Thresholds can be set by an administrator using Admin > Reports > Threshold Policies. |