Host Storage Usage Over Time
Use Search to find a template, report or dashboard by name. Search is case insensitive, supports partial entries, and will display a list of potential matches.
As you enter the name in the Search field, up to 10 potential matches are displayed. If the template, report or dashboard is shown, you can select and run it directly from the match list. You can also click All Items in the match list to go directly to the Search Results.
StorageConsole provides different navigation options to slice and examine your collected data. You can explore the data by using the APTARE customizable report templates or by using parts of your IT infrastructure as entry points. The Inventory Navigator serves as a browser for your infrastructure by object type. See also
Exploring Your Inventory.
Use the Reports tab to examine the StorageConsole catalog of templates, dashboards and reports - organized by products along with user-created, and system folders. This report is located here:
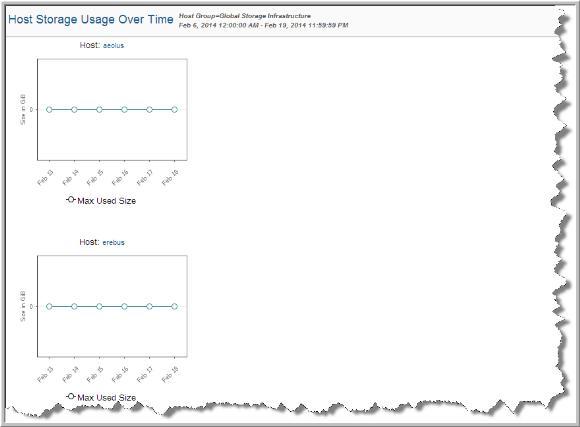
Capacity Manager > Storage Capacity & Forecast > Host Storage Usage Over Time
Line charts, aggregated by Host Groups or Arrays, and grouped by a configurable time period, show allocated capacity over time. You can view a historical perspective on the amount of storage allocated to the ESX Clusters or Server Groups. This helps to illustrate the growth of your environment by ESX clustered or Host Group.
Use the Capacity Forecast report to project growth in storage usage. You can generate the report by the following criteria:
• Historical date range
• Forecast horizon (date range)
• Storage Type (SAN, DAS and NAS)
• Host Type
In addition, you can choose to generate graphs for each host or instead, display a consolidated graph for all the hosts selected in the scope selector.