Hitachi Dynamic Provisioning Pool Utilization
Use Search to find a template, report or dashboard by name. Search is case insensitive, supports partial entries, and will display a list of potential matches.
As you enter the name in the Search field, up to 10 potential matches are displayed. If the template, report or dashboard is shown, you can select and run it directly from the match list. You can also click All Items in the match list to go directly to the Search Results.
StorageConsole provides different navigation options to slice and examine your collected data. You can explore the data by using the APTARE customizable report templates or by using parts of your IT infrastructure as entry points. The Inventory Navigator serves as a browser for your infrastructure by object type. See also
Exploring Your Inventory.
Use the Reports tab to examine the StorageConsole catalog of templates, dashboards and reports - organized by products along with user-created, and system folders. This report is located here:
Capacity Manager > Thin Provisioning Capacity & Utilization > Hitachi DP Pool Utilization
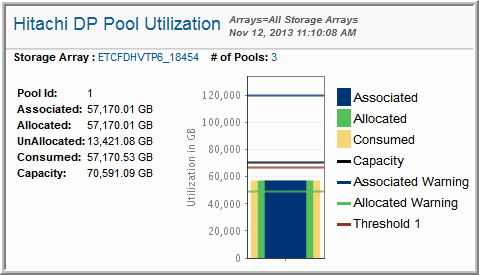
This dashboard provides an at-a-glance view of dynamically provisioned storage, enabling insight into potential exposure, as well as, storage that may be reclaimable.
Pool ID | The name of the Dynamic Provisioning Pool |
Array | The storage array on which the pool resides |
Associated | Of the DP Vols that have been created in the pool, Associated storage represents potential promised capacity; that is, the amount of storage that can be given to a host. The Associated Warning line defaults to 170%. |
Allocated | The green bar in the chart indicates exposure; this is storage that can be written to by a host. When the green bar crosses the Capacity line, there is potential that hosts may attempt to write to storage that is not physically available. The Allocated Warning line defaults to 70%. |
Unallocated | Unallocated = Capacity - Allocated storage |
Consumed | This is Consumed, or touched capacity; that is, the sum of the 42 MB pages assigned from the pool that have data written to them. Consumed could be greater than Allocated, in cases where de-provisioned hosts have not had storage reclaimed. Consumed can never exceed capacity, but as it nears capacity, this chart provides an indication of a potential issue. |
Capacity | This is the total physical size of all DP pool volumes that have been created within the pool. When Allocated (green bar) crosses this line, there may not be storage available for future writes. Note that the Threshold 1 line represents a % of capacity that is user-defined. If not customized, Threshold 1 defaults to 70%. |
Threshold1 | This is a user-definable threshold to monitor pool usage. If not customized by the user, the default value is 70%. |
Reclaimable Storage
There are times when storage is not in use, yet it’s difficult to make that determination. For example, a host can be de-provisioned and therefore the storage is un-masked, but data remains on the disk. These pages could be freed up and storage reclaimed. In the Hitachi DP Pool Utilization report, storage may be reclaimable when the Consumed value is greater than the Allocated value.

