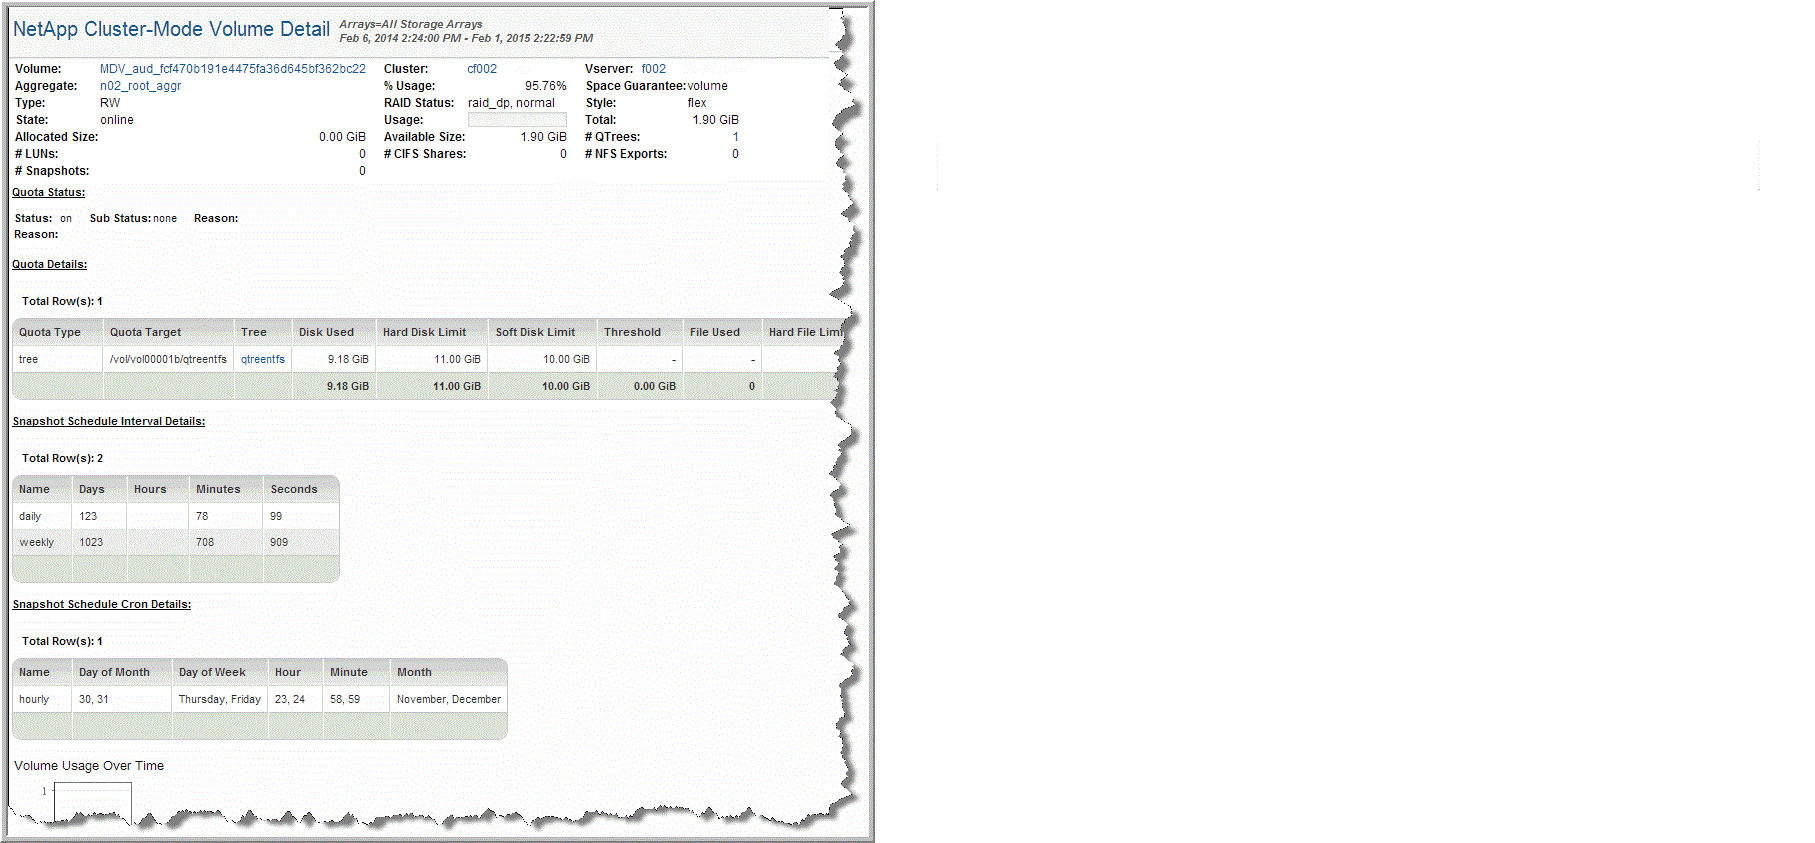
Next, click Volume Name.


Status | Indicates if quotas are enabled: on or off |
Sub-Status | Minor quota status for the volume, valid only when the status is either resizing or initializing. The sub-status could be: scanning, etc scanning, setup, queue scan, done, or none. |
Reason | If blank, there were no errors. Otherwise, this field displays the last quota error message. |
Reason | If blank, there were no errors. Otherwise, this field displays the collection of quota errors, including the reason code. |
Quota Type | User, group, or tree |
Quota Target | Name, number, or path name, relevant to the quota type |
Tree | Name of the QTree for this quota |
Disk Used | Current amount of disk space; “-” indicates unlimited |
Hard Disk Limit | The amount of disk space reserved for the target; “-” indicates unlimited. |
Soft Disk Limit | Both an SNMP trap and a log message are generated when the target exceeds this limit; “-” indicates unlimited. |
Threshold | When the target exceeds this amount of disk space, a message is logged |
File Used | Current number of files used by the quota target |
Hard File Limit | Number of files allowed for the target |
Soft File Limit | Both an SNMP trap and a log message are generated when the target exceeds this limit; “-” indicates unlimited. |
Quota User Name | Name of the User, Group, or SID (Windows security ID) |
Name | Name of the schedule. |
Days | Number of daily snapshots taken. |
Hours | Number of hourly snapshots taken. |
Minutes | Number of snapshots taken each minute. |
Seconds | Number of snapshots taken each second. |
Name | Name of the cron schedule. |
Day of Month | Day of the month scheduled to run. |
Day of Week | Day of the week scheduled to run. |
Hour | Hour the snapshot is scheduled to run. |
Minute | Minute the snapshot is scheduled to run. |
Month | Month the snapshot is scheduled to run. |