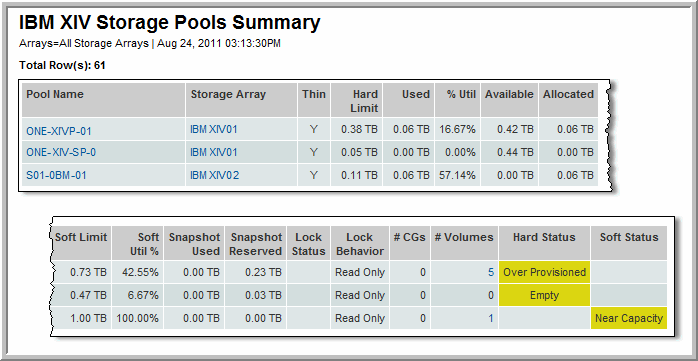
IBM XIV Storage Pools Summary
Use Search to find a template, report or dashboard by name. Search is case insensitive, supports partial entries, and will display a list of potential matches.
As you enter the name in the Search field, up to 10 potential matches are displayed. If the template, report or dashboard is shown, you can select and run it directly from the match list. You can also click All Items in the match list to go directly to the Search Results.
StorageConsole provides different navigation options to slice and examine your collected data. You can explore the data by using the APTARE customizable report templates or by using parts of your IT infrastructure as entry points. The Inventory Navigator serves as a browser for your infrastructure by object type. See also
Exploring Your Inventory.
Use the Reports tab to examine the StorageConsole catalog of templates, dashboards and reports - organized by products along with user-created, and system folders. This report is located here:
Capacity Manager > Array Capacity & Utilization> IBM XIV Storage Pools Summary
The XIV Storage Pools Summary report provides a view of IBM XIV storage pool consumption, including a hard and soft status indicators to draw attention to when physical and logical capacity has been over-provisioned are reaching capacity limits. For example, for growing LUNs, 30% utilized may not be considered to be over-provisioned. However, over time, it may warrant a second look to determine a more efficient approach to storage allocation.
When generating this report, the Scope Selector enables customization of the hard and soft capacity values used to render the report.
Pool Name | The name of the storage pool links to the XIV Storage Pool Details. |
Storage Array | Name of the XIV array links to the Array Capacity & Utilization report |
Thin | Y = thin provisioning |
Hard Limit | Maximum physical capacity that can be used by volumes and snapshots in the pool |
Used | Physical capacity used by the volumes (see Allocated) + Snapshot Used |
% Util | Used/Hard Limit |
Available | Capacity that is available for allocation |
Allocated | Amount of storage used by volumes; Note that Allocated does NOT include Snapshots. |
Soft Limit | The logical amount of space for all storage pools in the array. A soft limit greater than the hard limit indicates thin provisioning. |
Soft Util % | Soft Util % = Soft limit - Available/Soft Limit |
Snapshot Used | Amount of storage in use by snapshots |
Lock Status | Locked status |
Lock Behavior | Lock behavior, such as Read Only |
# CGs | Number of Consistency Groups associated with this pool, links to the XIV Consistency Group Summary report |
# Volumes | Number of volumes and snapshots associated with this pool, links to XIV LUN Utilization Summary report |
Hard Status | Physical Capacity Status: If % Util < 2% = empty, if % Util > 95% = near capacity, if % Util > 2% and <30% = over-provisioned |
Soft Status | Logical Capacity Status: If % Util < 2% = empty, if % Util > 95% = near capacity, if % Util > 2% and <30% = over-provisioned |


