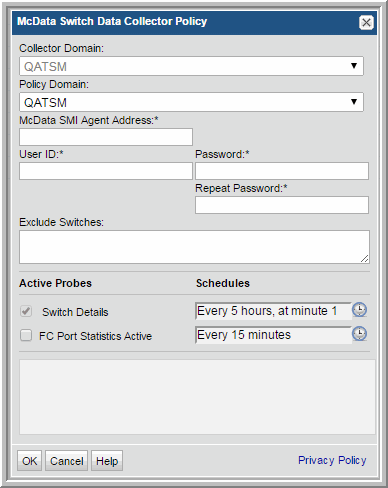

Field | Description | Sample Value |
Domain | The domain identifies the top level of your host group hierarchy. The name was supplied during the installation process. All newly discovered hosts are added to the root host group associated with this domain. Typically, only one Domain will be available in the drop-down list. If you are a Managed Services Provider, each of your customers will have a unique domain with its own host group hierarchy. To find your Domain name select Admin > Host and Domains > Domains. | yourdomain |
McData SMI agent address* | Enter the IP address of the McData switch. | 192.1.1.1 |
User ID* | Use the User ID and passcode for accessing the switch. This typically would be an administrator privilege, but must be a minimum privilege of a view-only user. | Administrator |
Password* | Note: The password is encrypted prior to saving in the database and is never visible in any part of the application. | Password1 |
Exclude Switches | Enter a switch WWN - e.g., 10:00:00:60:69:90:04:9F, 100000606990049F Colons within the WWN are NOT required. A comma-separated list is supported. | 10:00:00:60:69:90:04:9F, 100000606990049F |
Switch Details | Click the check box to collect switch details. Click the clock icon to create a schedule. Every Minute, Hourly, Daily, Weekly, and Monthly schedules may be created. Advanced use of native CRON strings is also available. Examples of CRON expressions: */30 * * * * means every 30 minutes */20 9-18 * * * means every 20 minutes between the hours of 9am and 6pm */10 * * * 1-5 means every 10 minutes Mon - Fri. Note: Explicit schedules set for a Collector policy are relative to the time on the Collector server. Schedules with frequencies are relative to the time that the Data Collector was restarted. | |
FC Port Statistics Active | Click the check box if you want to collect FC Port statistics. This may have a performance impact, which can be optimized with the FC Port schedule. Click the clock icon to create a schedule. |