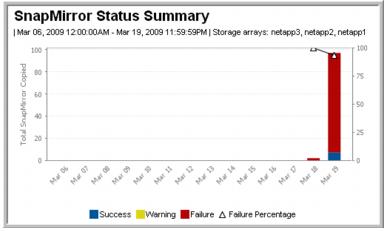
SnapMirror Status Summary
Use Search to find a template, report or dashboard by name. Search is case insensitive, supports partial entries, and will display a list of potential matches.
As you enter the name in the Search field, up to 10 potential matches are displayed. If the template, report or dashboard is shown, you can select and run it directly from the match list. You can also click All Items in the match list to go directly to the Search Results.
StorageConsole provides different navigation options to slice and examine your collected data. You can explore the data by using the APTARE customizable report templates or by using parts of your IT infrastructure as entry points. The Inventory Navigator serves as a browser for your infrastructure by object type.
Use the Reports tab to examine the StorageConsole catalog of templates, dashboards and reports - organized by products along with user-created, and system folders. This report is located here:
Replication Manager > SnapMirror Reports > SnapMirror Status
Note: SnapMirror Status is based on the last sampling of data. NetApp keeps track of the latest SnapMirror schedule, however, the data shown in this report reflects the history of what was captured from the NetApp SnapMirror data. In some cases, a SnapMirror transaction may have occurred between data collection cycles.
This bar chart provides an at-a-glance view of the success or failure for each selected time frame, such as days, weeks, or months. Mouse over the colored section of each bar to view the numeric details. Click on a colored section of a bar to drill down to the
SnapMirror Summary.

