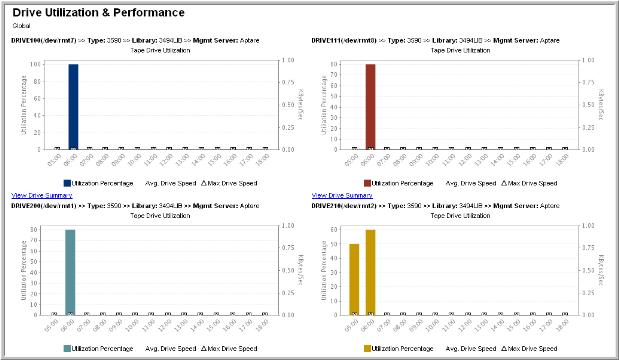
Drive Utilization & Performance Report
Use Search to find a template, report or dashboard by name. Search is case insensitive, supports partial entries, and will display a list of potential matches.
As you enter the name in the Search field, up to 10 potential matches are displayed. If the template, report or dashboard is shown, you can select and run it directly from the match list. You can also click All Items in the match list to go directly to the Search Results.
StorageConsole provides different navigation options to slice and examine your collected data. You can explore the data by using the APTARE customizable report templates or by using parts of your IT infrastructure as entry points. The Inventory Navigator serves as a browser for your infrastructure by object type.
Use the Reports tab to examine the StorageConsole catalog of templates, dashboards and reports - organized by products along with user-created, and system folders. This report is located here:
Backup Manager > Storage Utilization Reports > Drive Utilization & Performance
The Drive Utilization and Performance report enables you to view and compare utilization and performance of the tape drives in your environment. By viewing the total aggregate throughput per drive, you can use this information to help you tune your backup policies.
This report is applicable to only Veritas NetBackup, HP Data Protector, Commvault Simpana, IBM TSM, and EMC Networker.
Avg KBytes/Sec and Max KBytes/Sec is displayed for every bar during which an event finish time took place. These calculations are available only for periods of time when an event finished. So, if 20 events finish in one of the bar periods, the calculation is based on the average write speed for the total time for all 20 jobs / total bytes written. Likewise, using this example, Max speed would be the maximum of the averages of all 20 jobs.
The Portal does not tie into the hardware directly and monitor the actual drive write speeds. Instead, the reports use the data that the Data Collector retrieved from the backup software—including the amount of data written, job duration time, and job completion time—for each job.
Drive Details | For each drive, listed at the top of each Drive Utilization and Performance Chart: • Drive Name • Drive Type • Tape Library Name • Backup Management Server Click on the Backup Management Server name to view its Host Details page. |
Pop-up Details | Mouse‑over any chart bar or line symbol to view the corresponding values. |
Drive Summary | Click on the list at the bottom of each chart to go to the Drive Performance Summary Report, which lists all the backup events that took place on that drive for the time period that you specified in the report scope. Additionally, the min, max, and avg KBytes/Sec for the time period are provided at the bottom of the report. |
Avg & Max KBytes/Sec | The Avg KBytes/Sec and Max KBytes/Sec is displayed for every bar during which an event completed. If the report shows a bar with utilization but does not have accompanying line symbols, either no backups or restores completed during that time period or the drive was being utilized for another purpose, such as copying a tape to be vaulted. |
Local Start and End Times | Each chart displays the utilization and performance of one drive in the system. The start and end time for each chart is localized to the time zone where that drive’s management server is located. For example, if Drive A’s management server is located in the Pacific Standard Time Zone and Drive B’s management server is located in the Eastern Standard Time Zone (3 hours ahead of Drive A’s management server) and you ran the Drive Utilization and Performance Report for the last 12 hours, the Drive A chart’s start and end times would be 3 hours earlier than the chart for Drive B. This start/end time localization enables real time performance comparison between drives, even if they are located in different parts of the world. |

