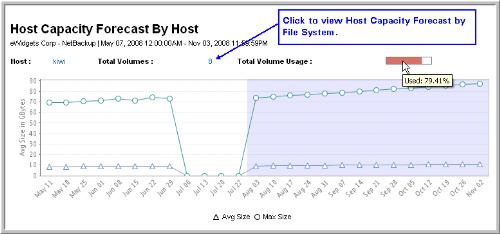
Host Capacity Forecast
Use Search to find a template, report or dashboard by name. Search is case insensitive, supports partial entries, and will display a list of potential matches.
As you enter the name in the Search field, up to 10 potential matches are displayed. If the template, report or dashboard is shown, you can select and run it directly from the match list. You can also click All Items in the match list to go directly to the Search Results.
StorageConsole provides different navigation options to slice and examine your collected data. You can explore the data by using the APTARE customizable report templates or by using parts of your IT infrastructure as entry points. The Inventory Navigator serves as a browser for your infrastructure by object type.
Use the Reports tab to examine the StorageConsole catalog of templates, dashboards and reports - organized by products along with user-created, and system folders. This report is located here:
Capacity Manager > Storage Capacity & Forecast > Host Capacity Forecast
This forecast report provides an at-a-glance overview of historical and predicted usage.
NOTE: To ensure that your report reflects both historical and forecasted usage, when you generate the report, verify that your date range starts on a past date and ends on a future date. The current day is treated as the future for the purpose of forecasting. Typically, if you specify three months before and after the current day, you’ll have sufficient data for a valid forecast. The default display is Grouped by Months. However, to see results based on previous weeks, choose Group by Weeks in the Report Designer. The Group by Weeks option is especially useful during the first few weeks of Capacity Manager deployment.
In the report’s scope selector, the Host Type option can be used to include virtual hosts in this host-based report: VM Guest, VM Server, VIO Guest, VIO Server, or Others. You also can narrow the scope of this report by specifying a storage type filter of: SAN, DAS, or NAS.
When you generate this report, you can select the type of output—either by host or by filesystem. If you select filesystem, the specific path, host name, and mount point will be associated with each graph.
1. Mouse-over the thermometer to view usage.
2. Mouse-over the markers on the lines to view:
• Historical Usage: Average and Maximum Size
• Forecasted Usage: Average and Maximum Size
4. Click the Total Volumes link to view the Host Capacity Forecast by Filesystem.
Date | The first day of the period for which the usage is projected. |
Avg Size | The historical average usage. |
Max Size | The historical maximum usage. |
Avg Size Future | The projected usage based on the average usage history (or historical average usage for periods in history). |
Max Size Future | The projected usage based on the maximum usage history (or historical average usage for periods in history). |

