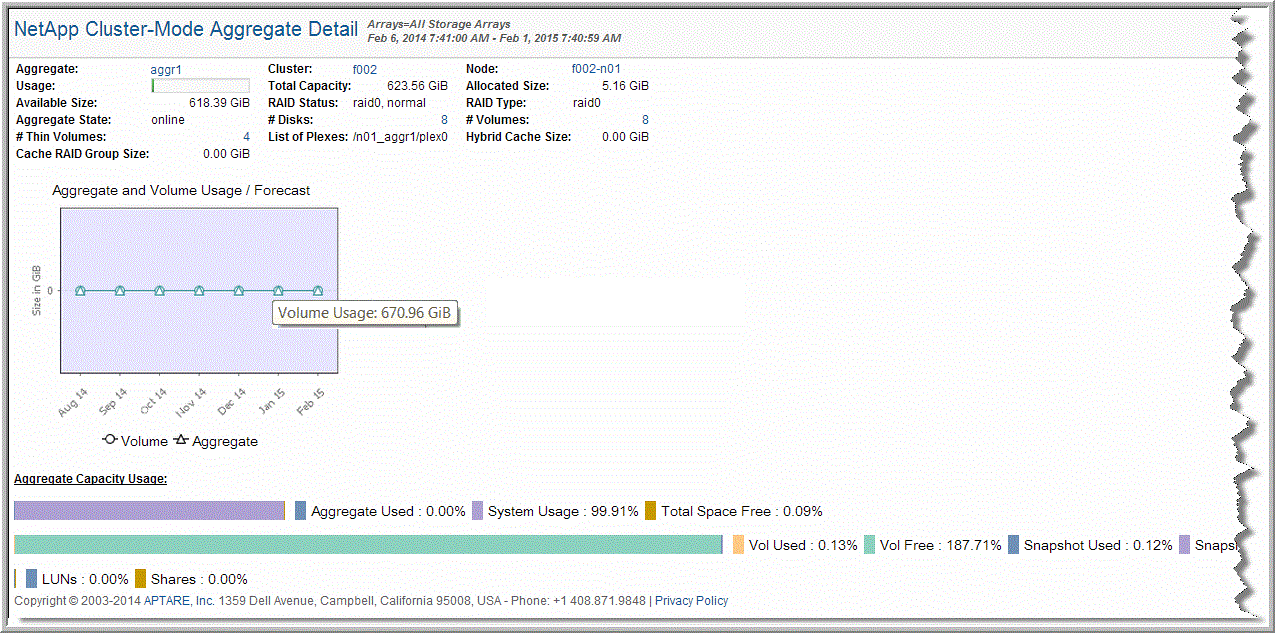

Aggregate | Name of the NetApp aggregate. Drill down to NetApp Volumes at Risk. |
Usage | Usage = Allocated Size / Total Capacity |
Available Size | Available bytes in the aggregate. |
Aggregate State | Aggregate state. |
# Thin Volumes | Number of thin provisioned volumes in the aggregate. |
Cache RAID Group Size | Maximum cache RAID group size of a hybrid aggregate. RAID group size is the maximum number of disks that can be added to a RAID group. Values are stored as KiB in the database and rendered according to your user profile preferences. |
Cluster | Name of the storage array. Drill down to Array Capacity and Utilization (NetApp Cluster). |
Total Capacity | Total size (in bytes) of the file system. If the file system is restricted or offline, this value is 0. |
RAID Status | RAID status - comma separated list of values. |
# Disks | Number of disks in the aggregate. |
List of Plexes | Lists 1 or 2 Plexes—2 if SyncMirror is licensed and enabled. Links to the NetApp Plex Details report. |
Node | The textual name of the node. Drill down to NetApp Cluster-Mode Node Summary. |
Allocated Size | Number of bytes used in the file system. If the file system is restricted or offline, this value is 0. Values are stored as KiB in the database and rendered according to your user profile preferences. |
RAID Type | RAID type. Possible values: raid0 = All the RAID groups in the aggregate are of type RAID 0. raid4 = All the RAID groups in the aggregate are of type RAID 4. raid_dp = All the RAID groups in the aggregate are of type RAID DP.mixed_raid_type The aggregate contains RAID groups of different RAID types (RAID 0, RAID 4, RAID DP). |
# Volumes | Number of volumes in the aggregate. Drill down to NetApp Volume Summary. |
Hybrid Cache Size | Total cache size (in bytes) for a hybrid aggregate. If the aggregate is restricted or offline, or if it is not a hybrid aggregate, this value is 0.Values are stored as KiB in the database and rendered according to your user profile preferences. |